
 Entri Finacademy తెలుగు
Entri Finacademy తెలుగు Facebook ad: “Want to Understand Stock Market Charts?”
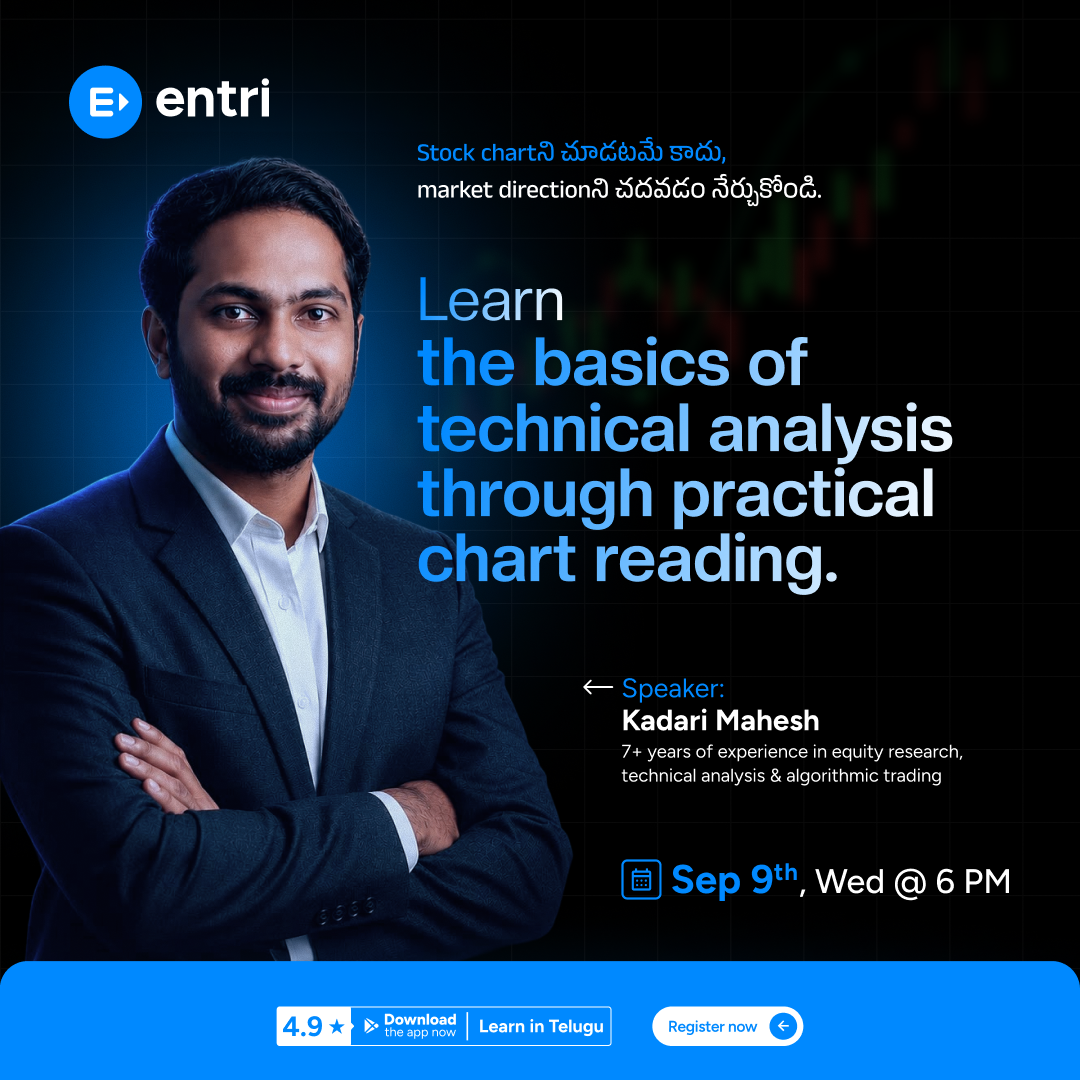
Ran for 6 days, from September 3 to September 9, 2026, the last day Crush saw it.
Run by Entri Finacademy తెలుగు on Facebook. Crush is not the advertiser and does not verify its claims. See this ad in Meta's Ad Library(opens in a new tab)
Want an ad like this for your product?
Crush makes new ad images for your product from this ad: your logo, your product photo, your offer.
Trials from $19.95 USD, then $79.95 USD a month. Cancel anytime.
About this ad
- Meta Ad Library ID
- 1027699933596692
- Platforms
- Facebook, Instagram and Audience Network
- Relaunches
- 0
- Niche
- Finance & Trading
Ad text
A stock chart can look complicated when you don't know what to look for. But once you understand candlesticks, timeframes and trends, the chart starts making much more sense. In this 30-minute webinar, Kadari Mahesh will break down the basics of chart reading in a simple, beginner-friendly way. With 7+ years of experience in equity research, technical analysis and algorithmic trading, he'll walk you through the fundamentals you need to start understanding price charts. 📅 9 September 2026 | Wednesday Register now to attend the live session.
Where the ad sends people
fb.me
Want to Understand Stock Market Charts?
Free Live Webinar | 9 September | Learn Candlesticks, Timeframes & Trends
Sign up: fb.me(opens in a new tab)