

Active· since Aug 5, 2026
- 46
- days running
- 0
- relaunches
Ad copy
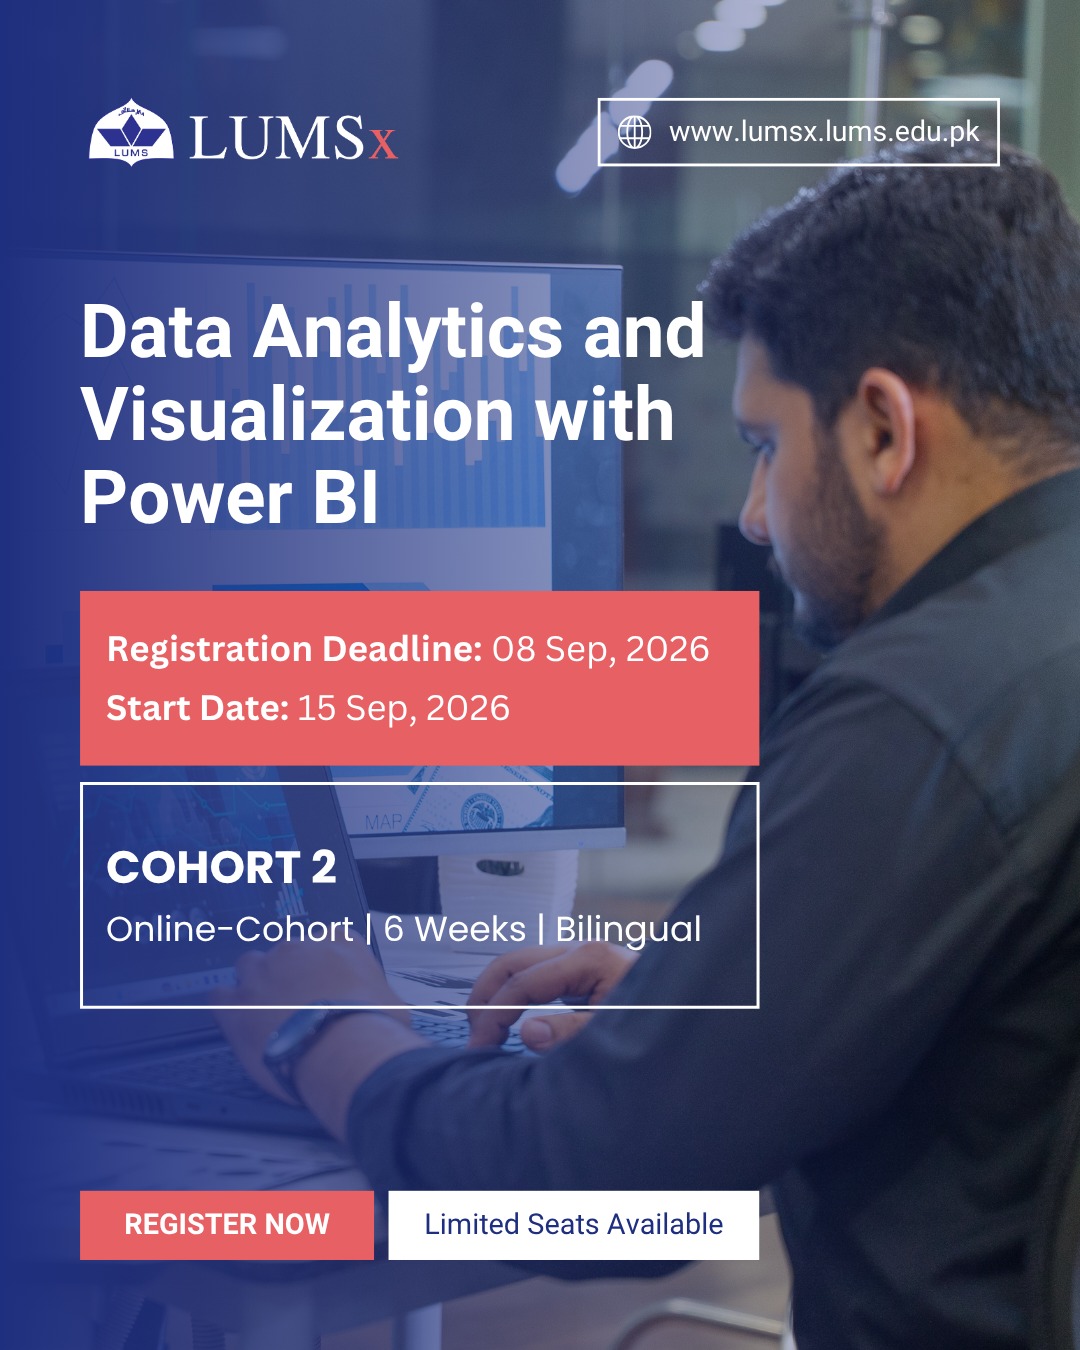
Trying to break into Data Analytics… but stuck in tutorials and theory? You’re not alone, most courses don’t show you how to actually work with data. This course changes that. Learn step-by-step with hands-on practice: 1)Data analytics fundamentals (no jargon overload) 2)Data visualization that actually makes sense 3)Power BI, Power Query & DAX, applied on real data-sets 4) Build dashboards and reports from scratch So you don’t just learn, you can actually analyze real-world data confidently, create dashboards that drive decisions, and build projects you can showcase professionally. Start Date: Sept 08, 2026 Deadline: Sept 15, 2026 Limited seats are available. Register now: https://lumsx.lums.edu.pk/data-analytics-and-visualization-with-power-bi-2/
Data Analytics and Visualization with Power BI - LUMSx
This course offers a comprehensive, hands-on introduction to data analytics, data visualization, and Business Intelligence, with a strong practical focus on Microsoft Power BI. Designed for beginners and early-career professionals, the course is structured in three progressive parts that move learne...
APPLY NOWLike this ad? Make it yours.
Crush rebuilds this exact creative around your product — your brand, your colors, your offer — in about a minute.