 Turf Vision
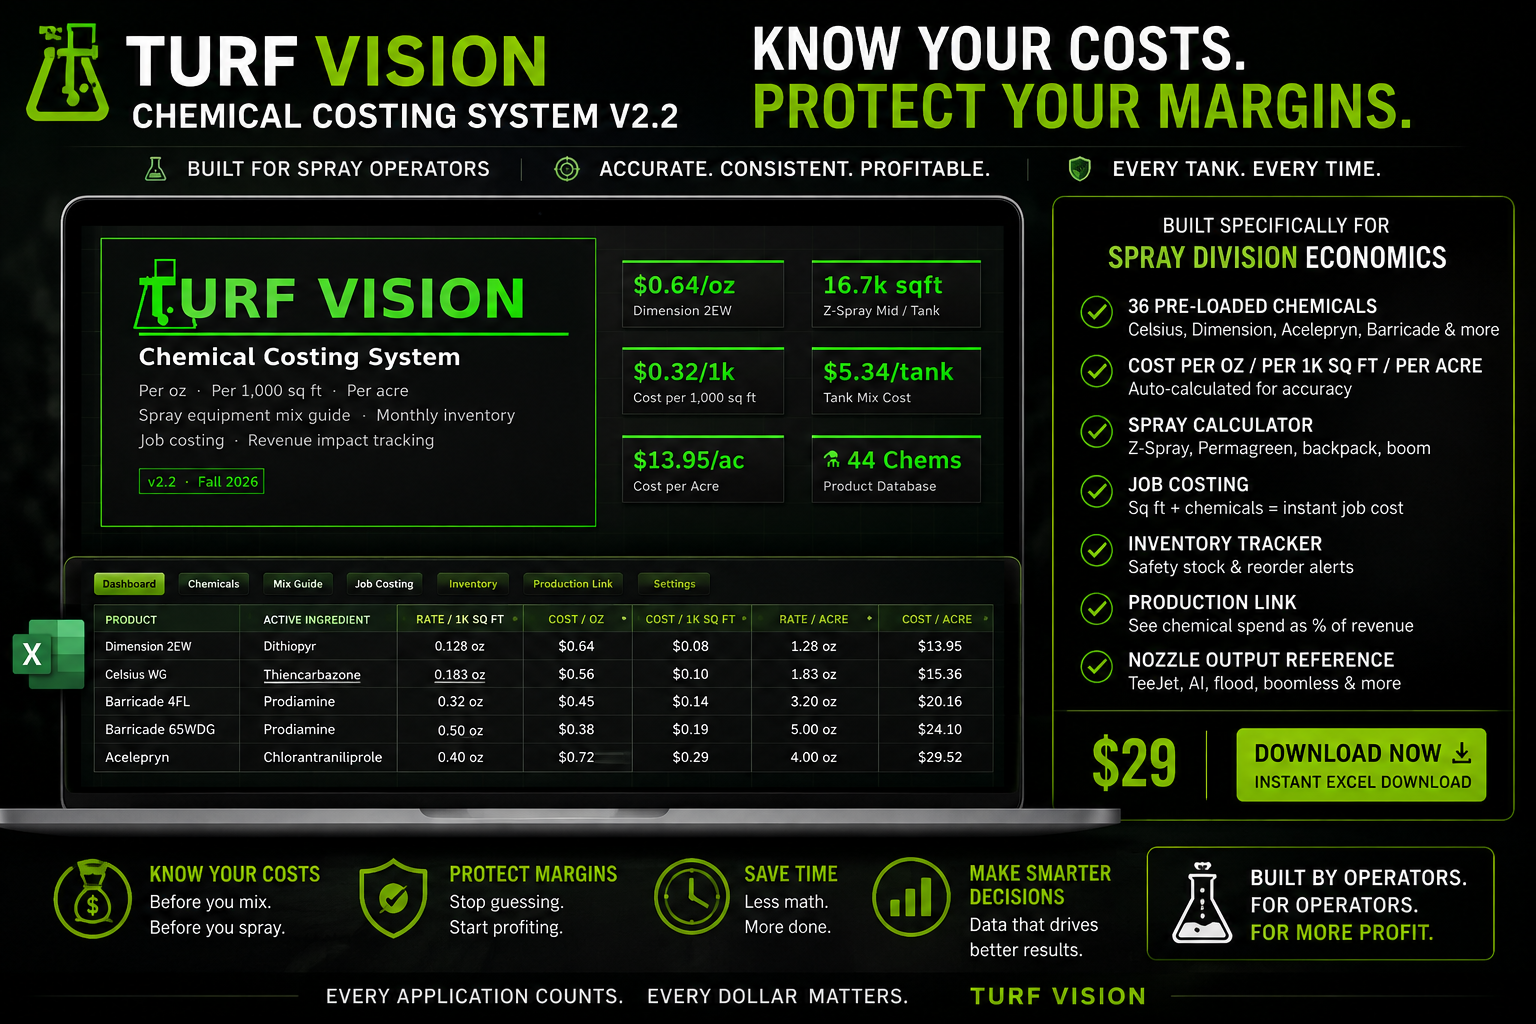
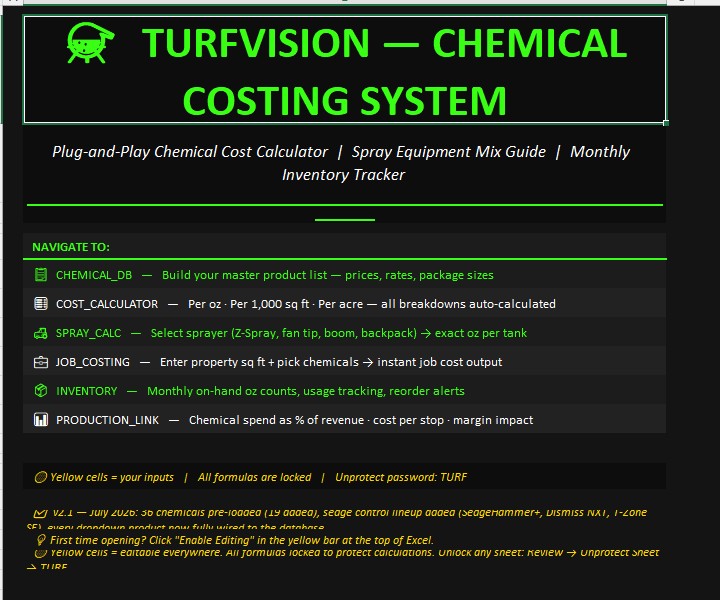
Turf Vision Facebook ad: “TurfVision, Lawn Care Business Toolkit”
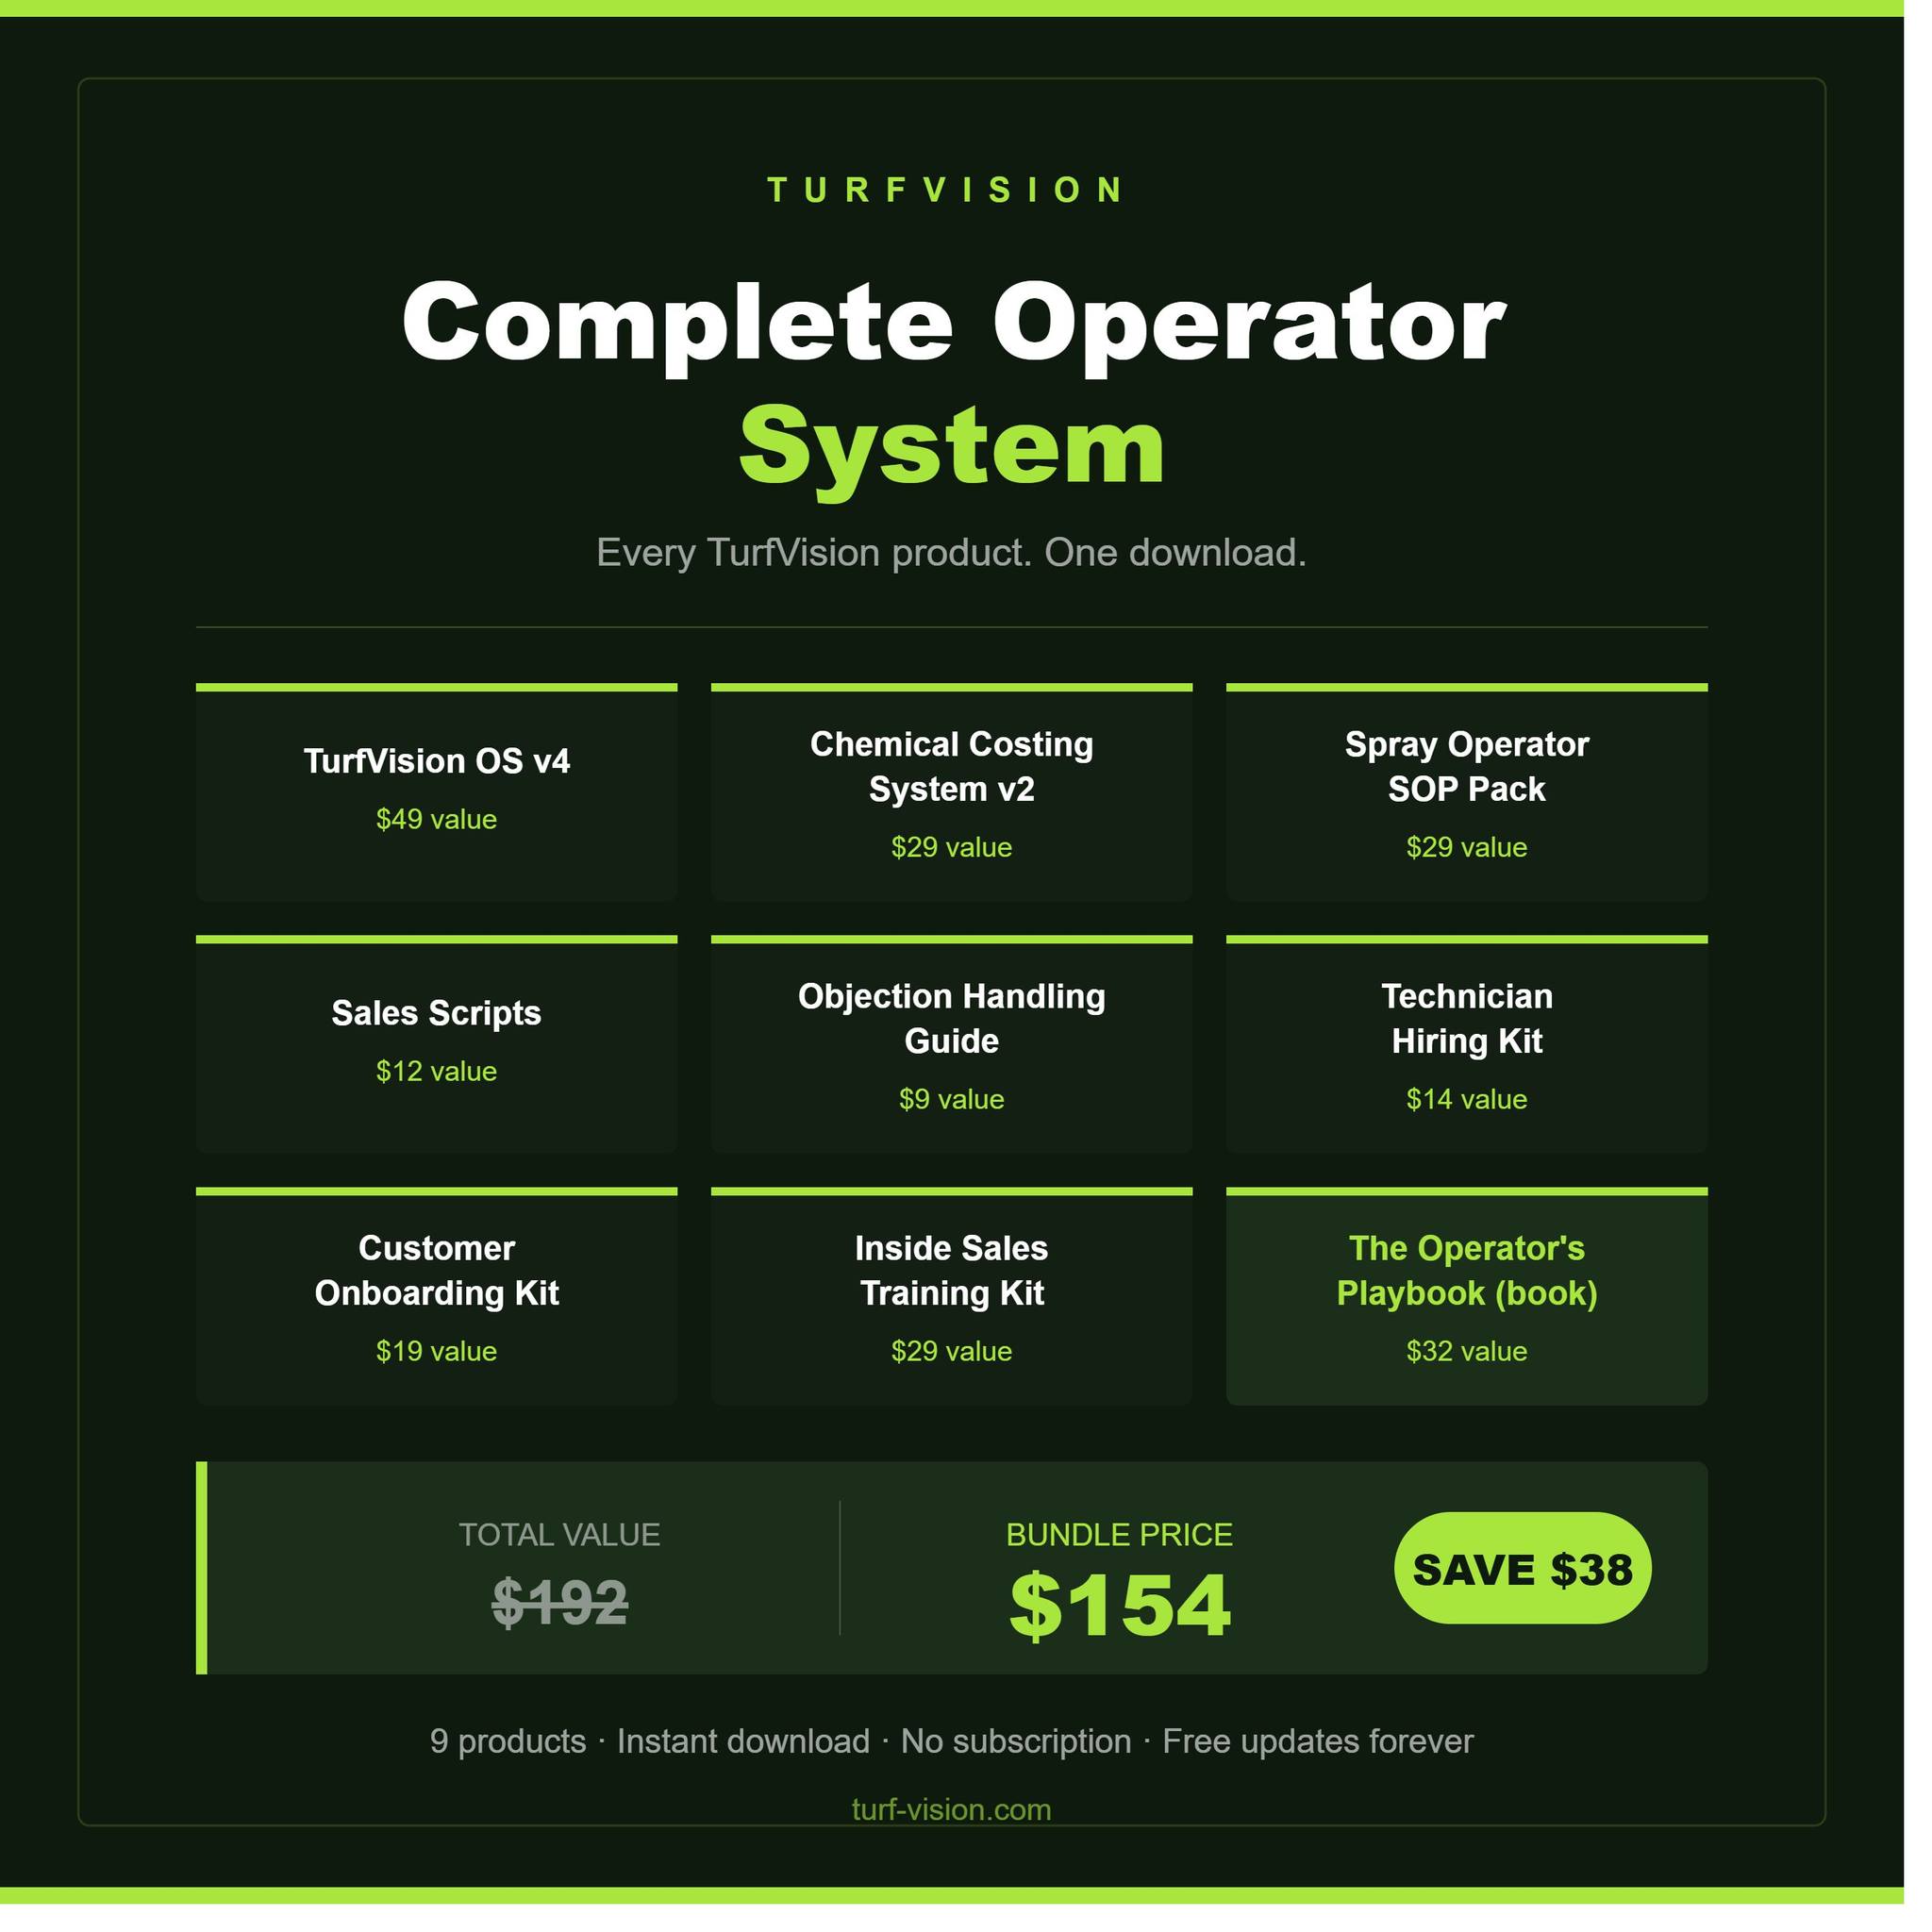
Ran for 5 days, from June 22 to June 27, 2026, the last day Crush saw it.
Run by Turf Vision on Facebook. Crush is not the advertiser and does not verify its claims. See this ad in Meta's Ad Library(opens in a new tab)
Want an ad like this for your product?
Crush makes new ad images for your product from this ad: your logo, your product photo, your offer.
Trials from $19.95 USD, then $79.95 USD a month. Cancel anytime.
About this ad
- Meta Ad Library ID
- 1458741445942066
- Platforms
- Facebook, Instagram, Audience Network, Messenger and WhatsApp
- Relaunches
- 0
- Niche
- Business & Money
Ad text
The single number that separates a $500k operation from a $1M+ one: Stops per tech per hour. Not revenue. Not trucks. Not customers. Stops per hour. Here's why it matters more than anything else on your P&L: 📊 Tech A: 3.2 stops/hour x 6 production hours = 19.2 stops/day 📊 Tech B: 1.9 stops/hour x 6 production hours = 11.4 stops/day Same wage. Same truck. Same fuel cost. At $47 average ticket: Tech A: $902/day in revenue Tech B: $536/day in revenue $366/day gap per tech. On a 5-tech operation over 120 production days = $219,600 in revenue variance. That's not a bad hire. That's a missing production system. When your techs don't have a stop target, a route sequence standard, or a pre-trip routine, output defaults to whatever they bring individually. The fix: track stops/hour per tech per day. Post it. Talk about it. Build a standard around it. You can't manage what you don't measure. What's your current average stops/hour? Drop it below 👇 #LawnCare #RouteEfficiency #LCO #OperatorMindset
Where the ad sends people
turf-vision.com
TurfVision — Lawn Care Business Toolkit
Shop now: turf-vision.com(opens in a new tab)