 Jim’s trading journal
Jim’s trading journal Facebook ad: “Read if you have an MT5 indicator”

Ran for 1 day, from April 1 to April 2, 2026, the last day Crush saw it.
Run by Jim’s trading journal on Facebook. Crush is not the advertiser and does not verify its claims. See this ad in Meta's Ad Library(opens in a new tab)
Want an ad like this for your product?
Crush makes new ad images for your product from this ad: your logo, your product photo, your offer.
Trials from $19.95 USD, then $79.95 USD a month. Cancel anytime.
About this ad
- Meta Ad Library ID
- 787767854062680
- Platforms
- Facebook and Instagram
- Relaunches
- 1
- Niche
- Finance & Trading
Ad text
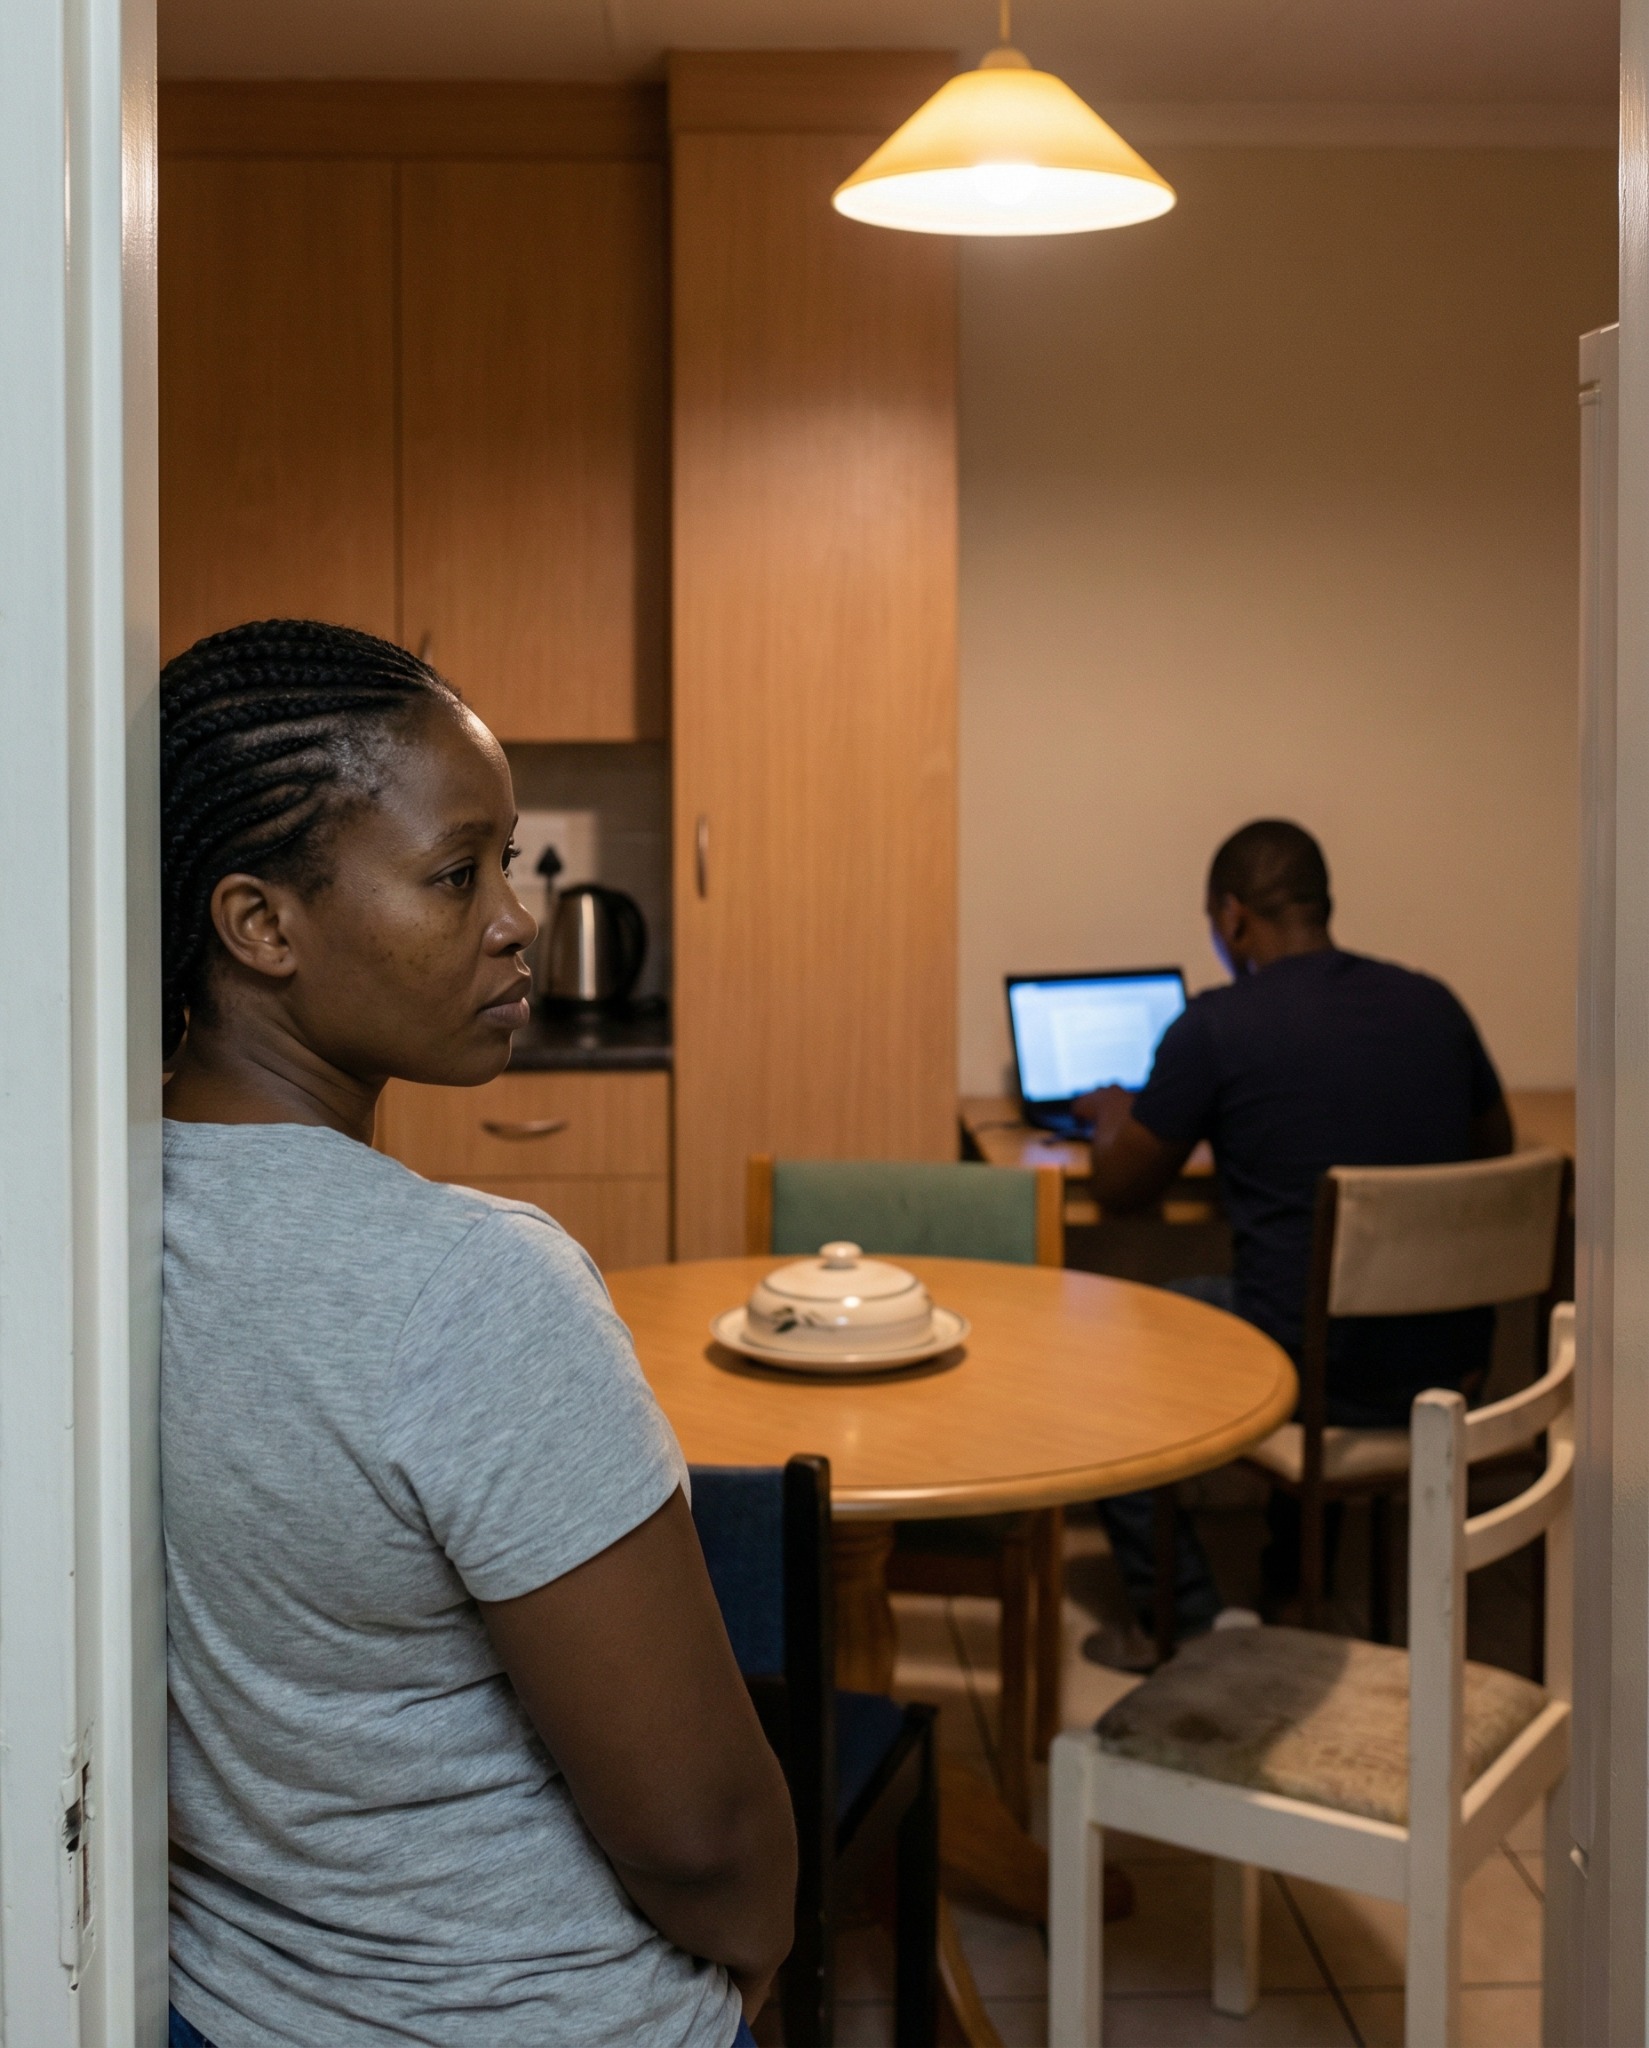
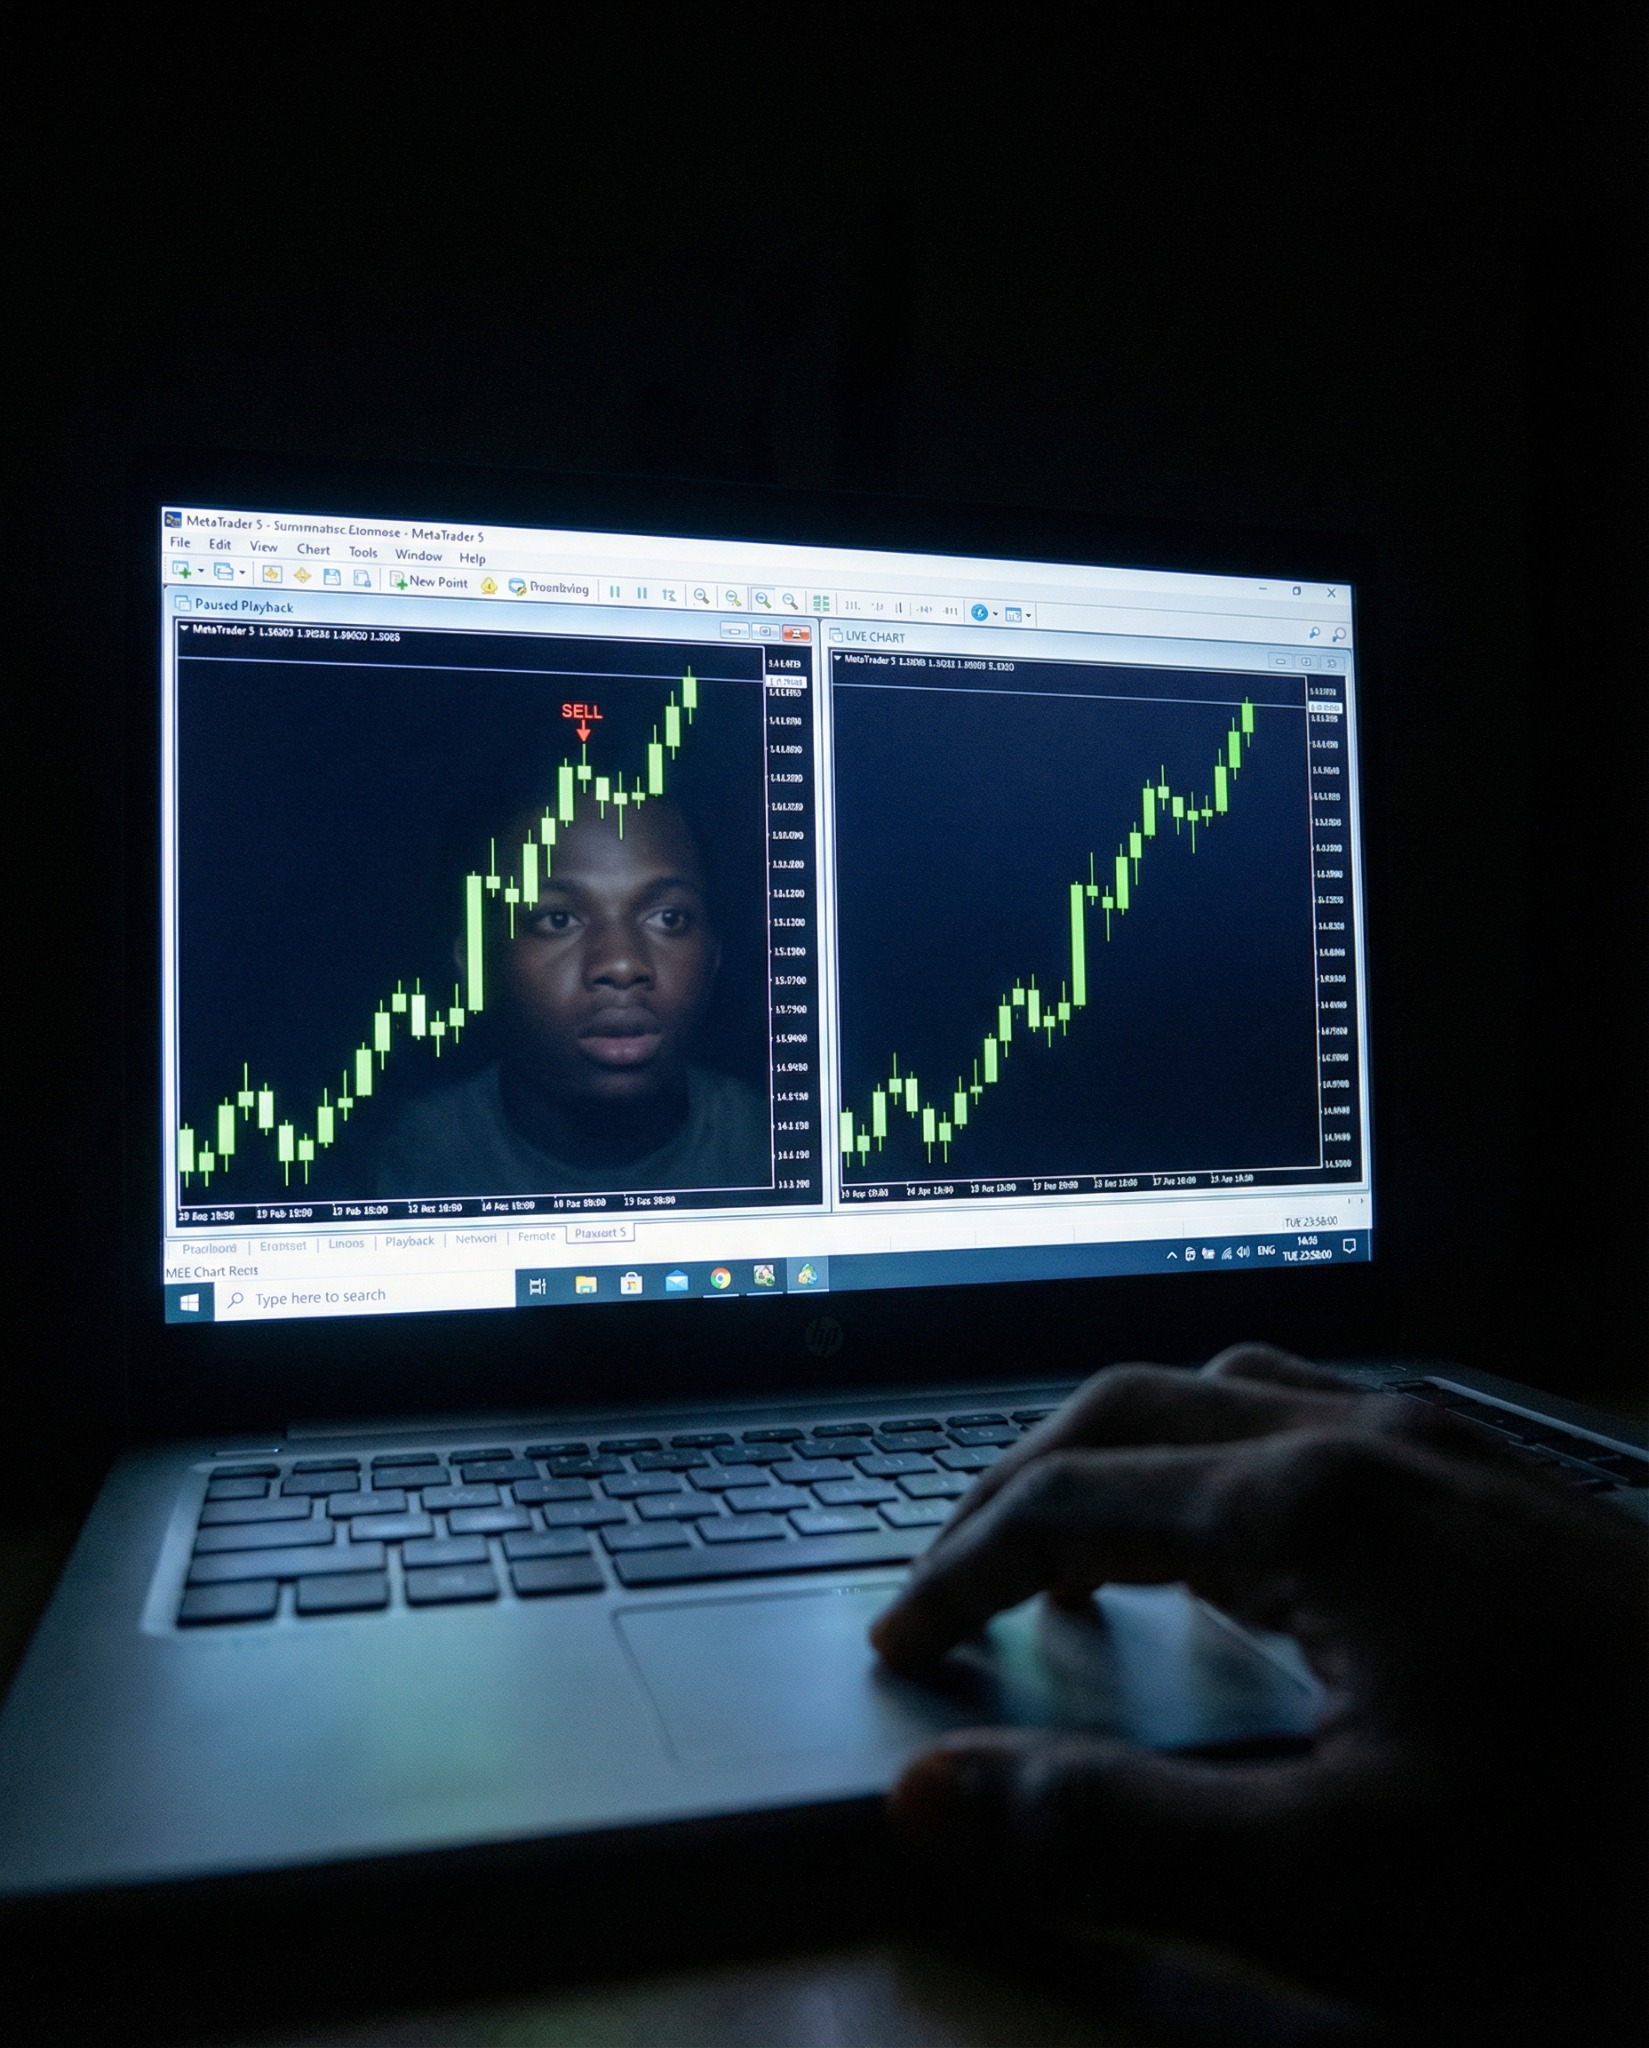
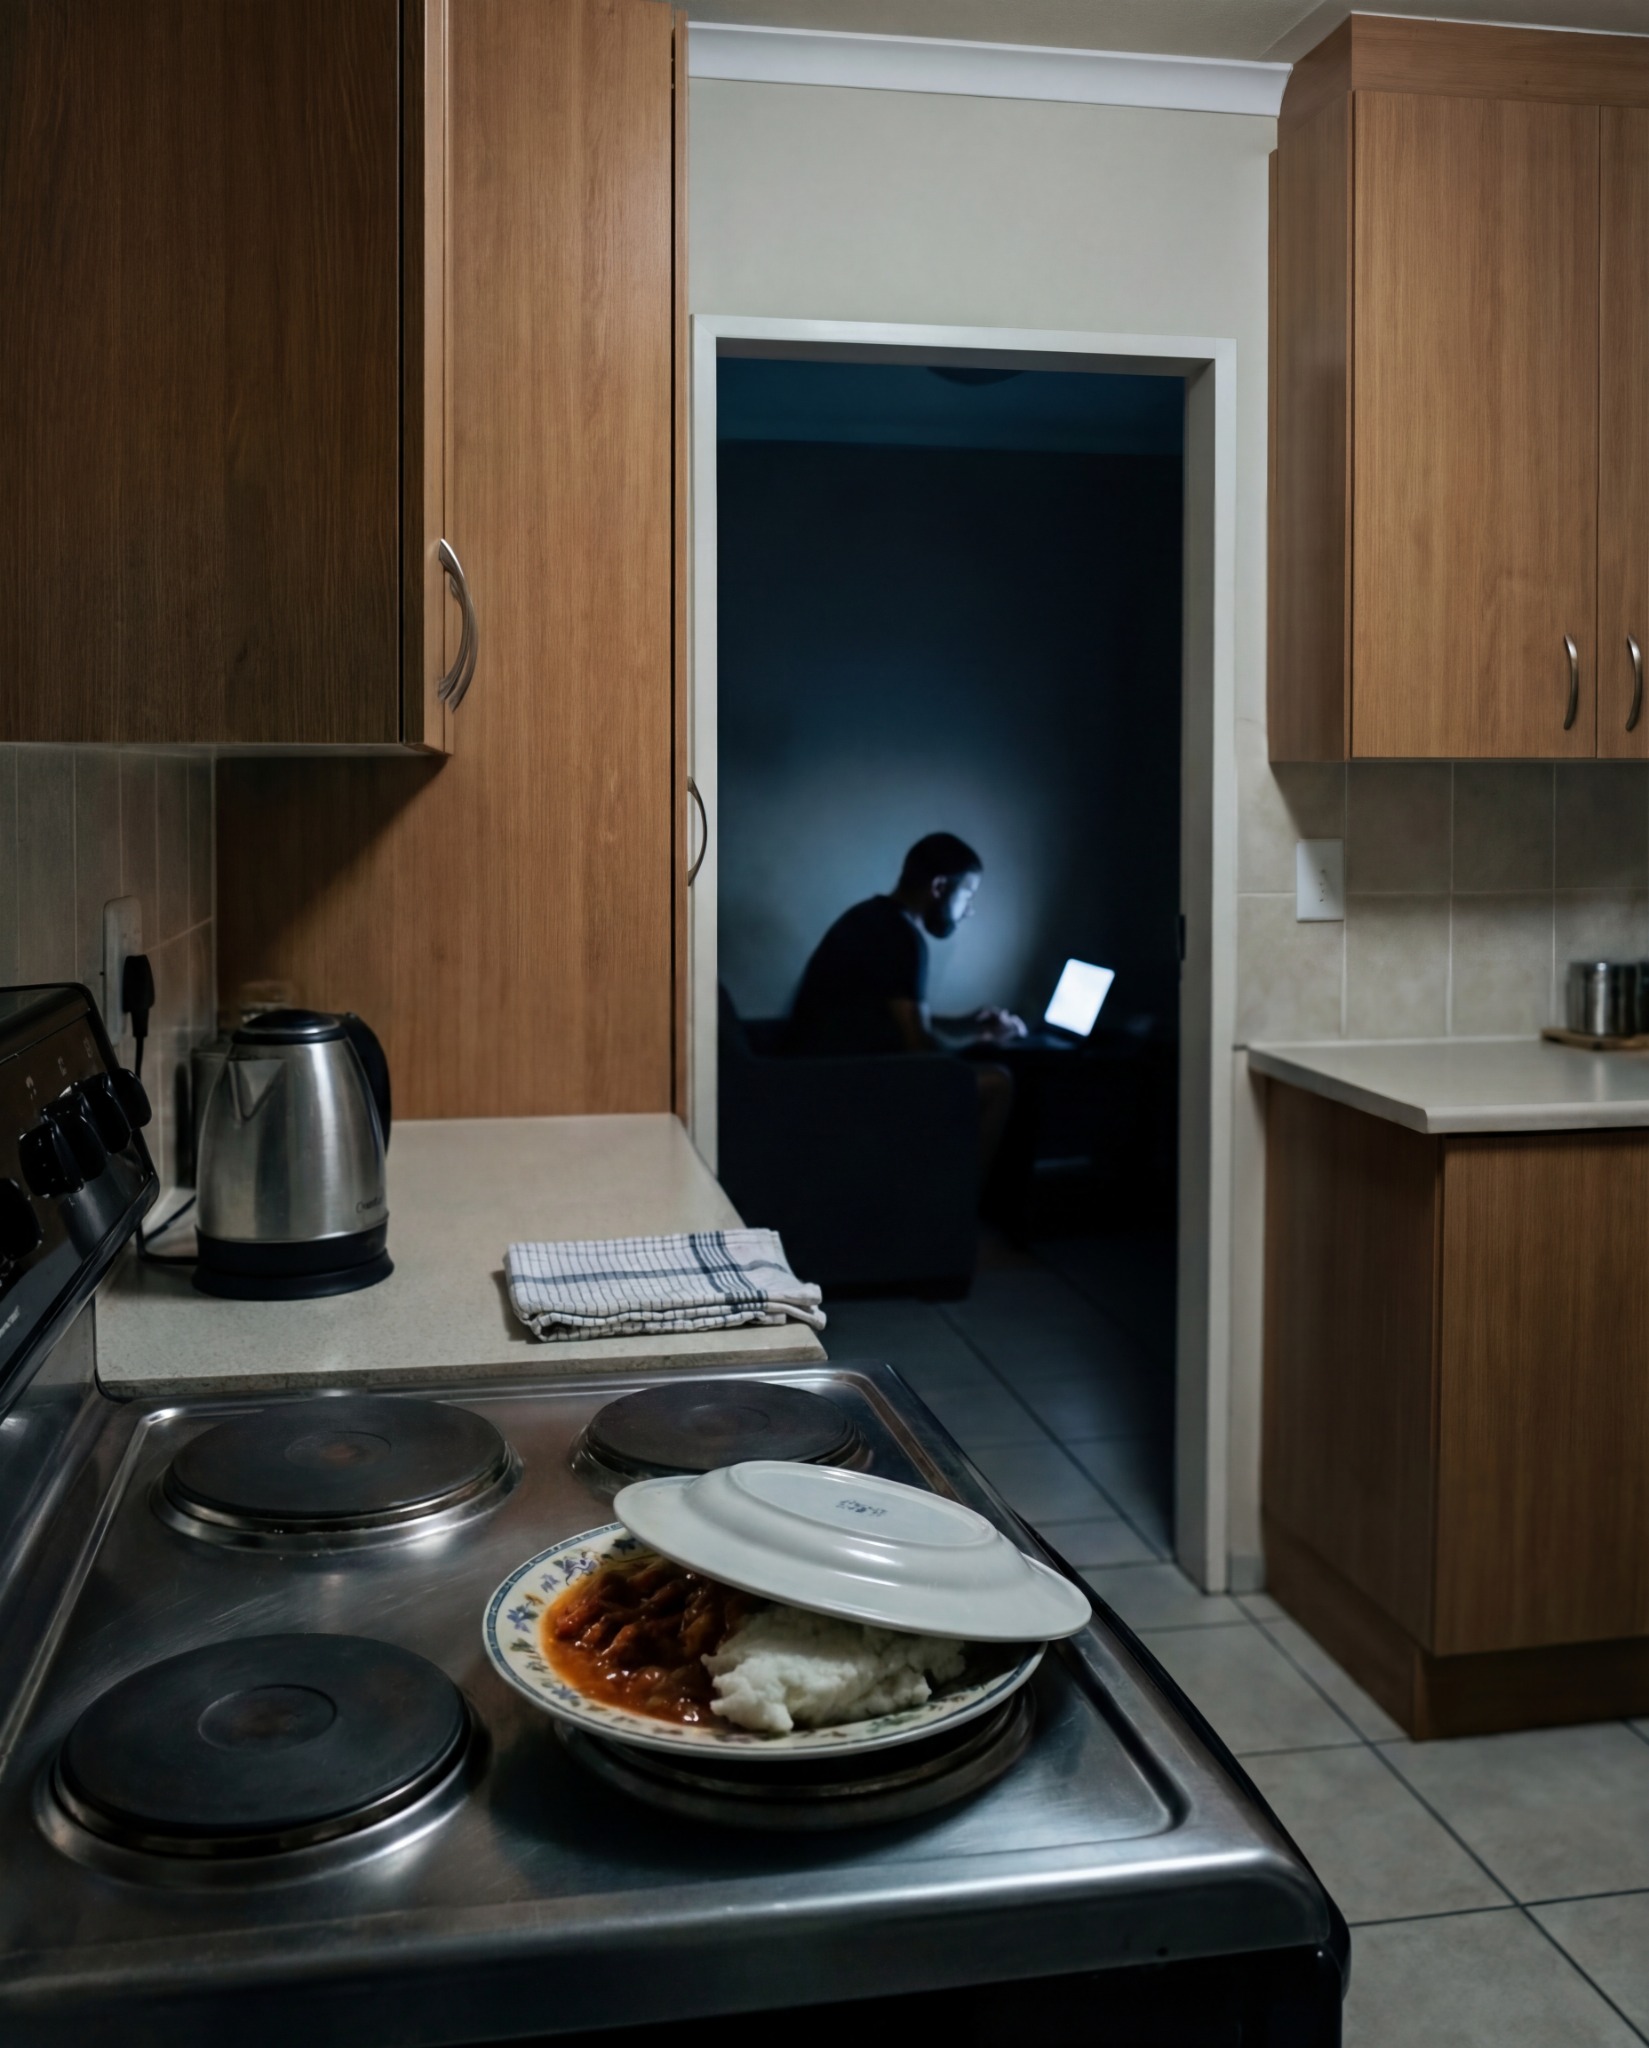
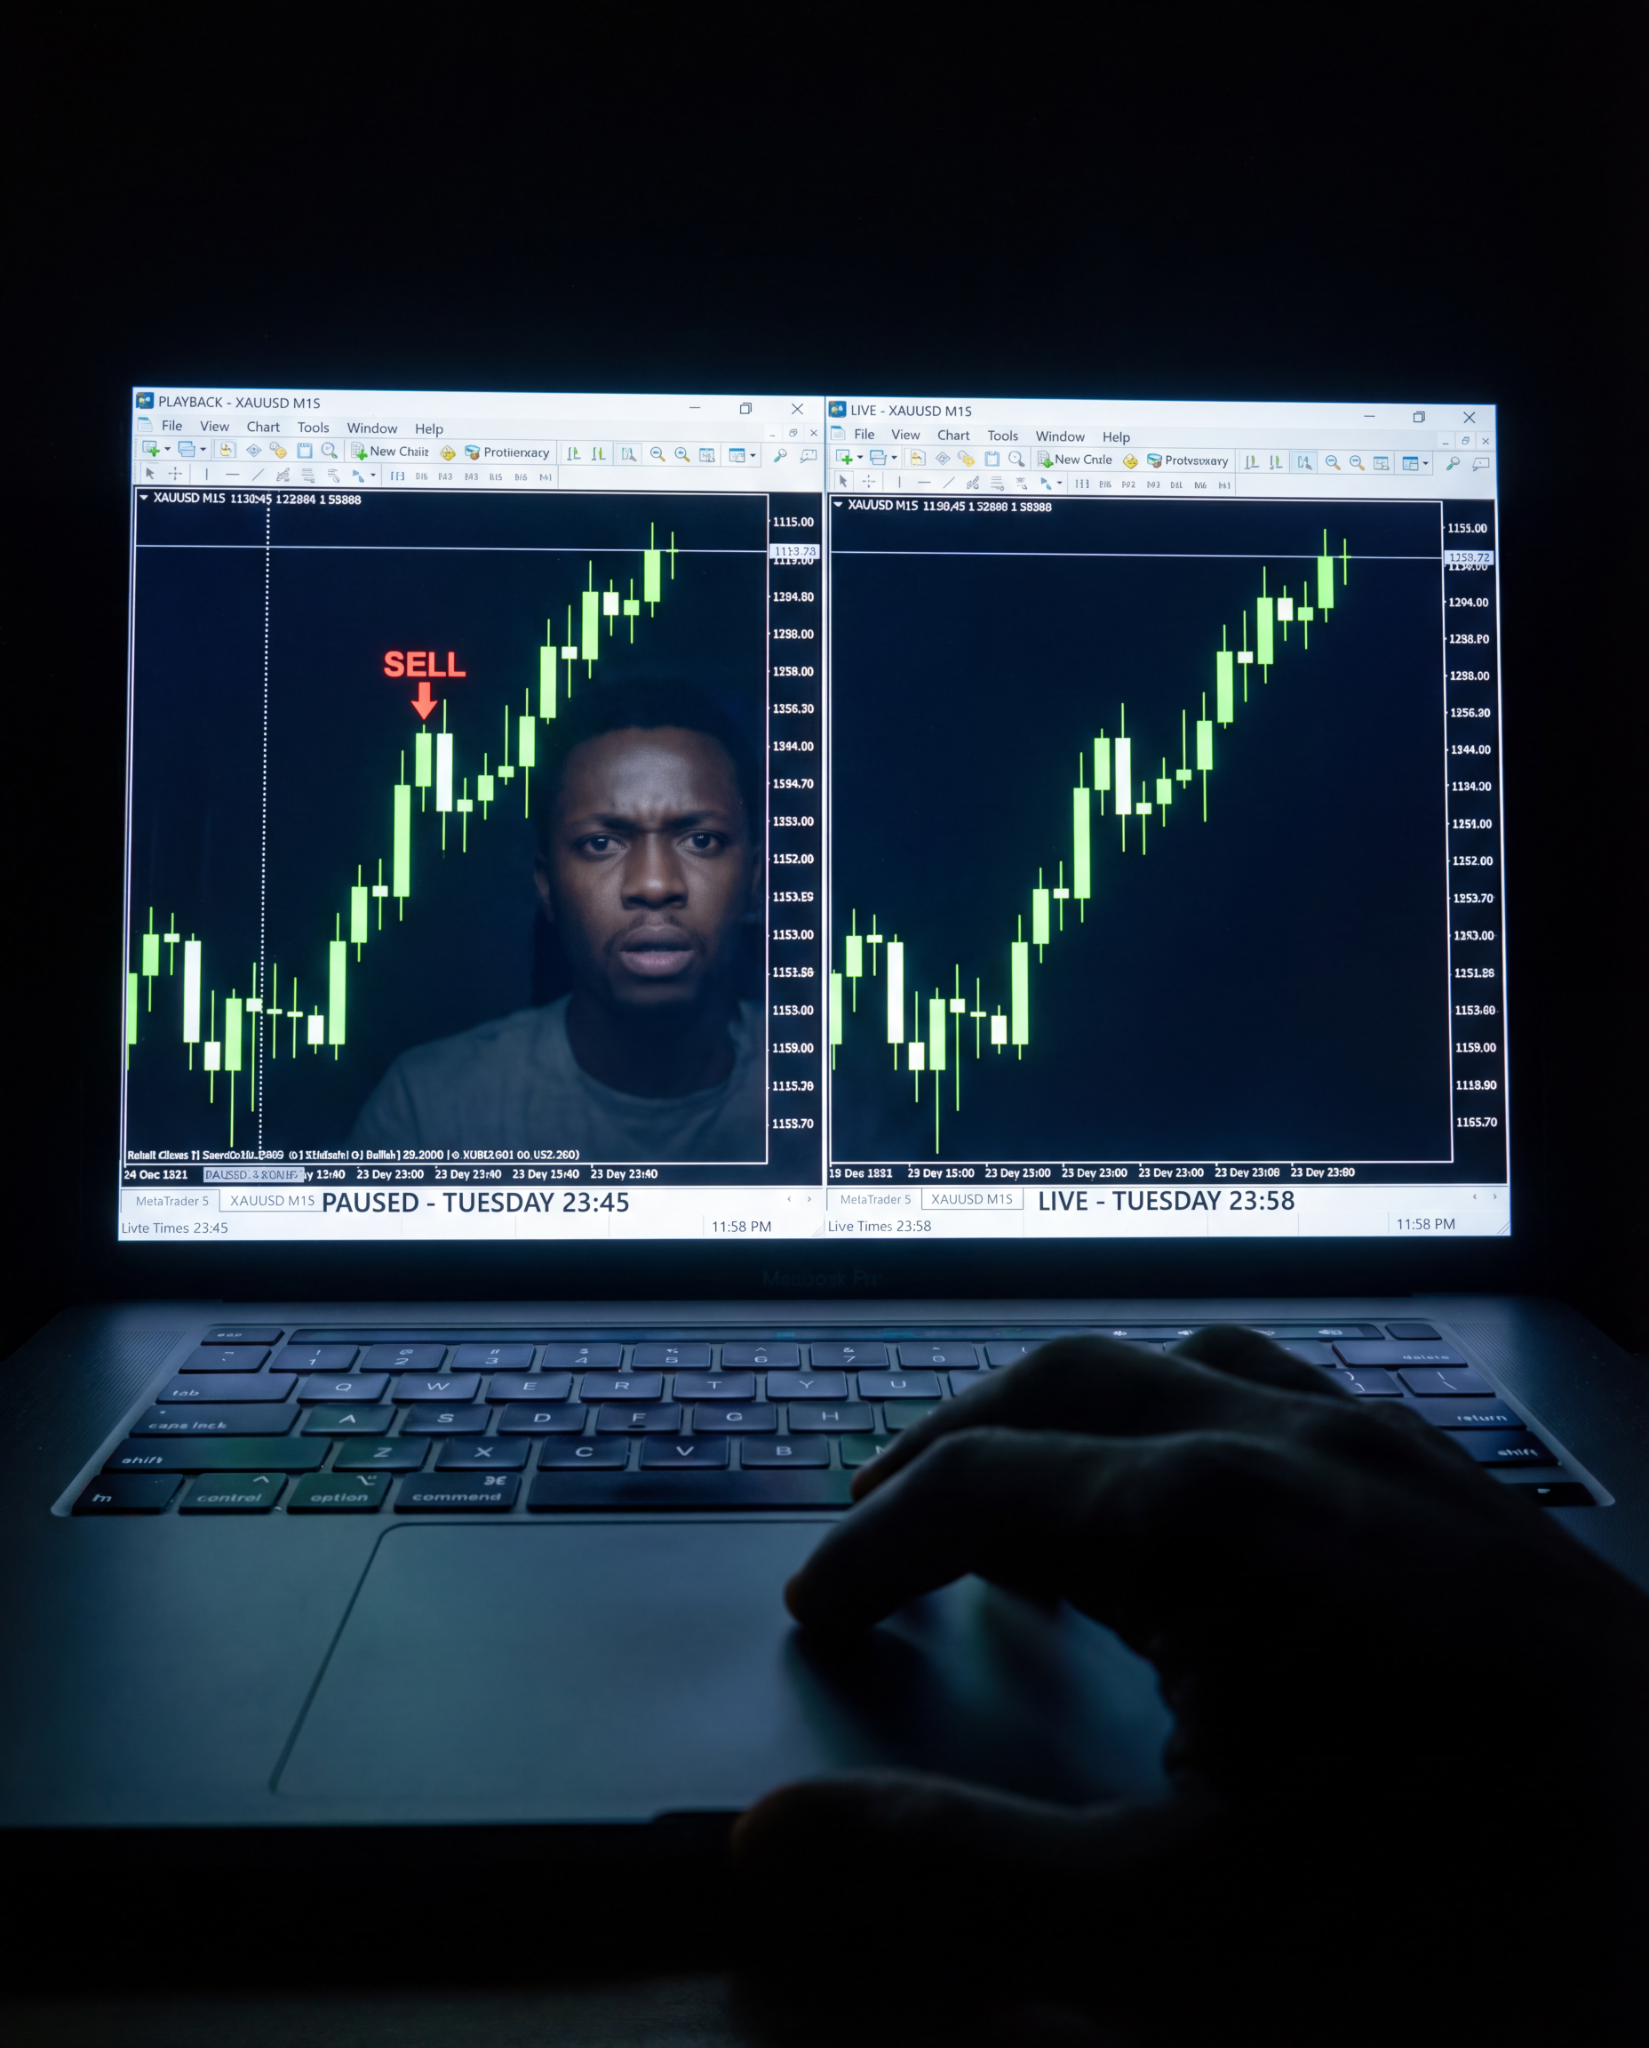
"Does it repaint?" That's the first question I ask now before I even look at anything else. I learned that the hard way and it cost me more than I want to admit. Let me tell you about a Tuesday night in November. It was past midnight. I'd been staring at my MT5 chart for three hours. My Exness account was sitting at R1,100 down from R3,200 that same morning. I hadn't eaten supper. I remember that specifically because my wife had left a plate on the stove and I walked past it four times without picking it up. I'd taken three trades on Nas100 that day. All three stopped out. Not by much...just enough. Each time, I watched the price turn exactly where I expected it to turn, but not before it hit my stop first. My indicator had given me the signal. The arrow was right there. I entered. Price moved against me, took my stop, then reversed and ran 200 pips in the direction I originally traded. Three times in one day. I remember sitting there thinking: am I going crazy? Or is this thing actually doing this to me on purpose? I'd been trading for almost three years at that point. I'm not a beginner. I understand structure. I know what a higher high looks like. I've watched enough YouTube to fill a library. I've spent money on two different indicators before this one. One was R900, one was R1,500. I'm not proud of those numbers. But I kept telling myself the same thing: it's your psychology. It's your risk management. It's your discipline. That's what everyone says. The gurus. The YouTube guys. The R4,000 mentor who spent four weeks teaching me moving averages I could have found for free on BabyPips. "Work on your mindset, bro." I believed them. For three years I believed them. So every time I lost, I blamed myself. I journaled. I took breaks. I reduced my lot size. I breathed differently before I clicked the button. And I still lost. That Tuesday night, I did something I'd never done before. Not because I read it somewhere. Not because someone told me to. I did it because I was tired and frustrated and I ran out of other ideas. I went back to my chart. Not to review my trades, I'd done that already, and it made me feel worse. I went back to look at the indicator itself. Specifically, I wanted to see where the arrows had been when I first entered. I use a screen recorder on my laptop. Force of habit, I started recording my sessions months ago so I could review my decision-making. I pulled up the recording from that morning. And I watched. At 9:47 AM, the indicator printed a buy arrow at a specific price. Clear. Definitive. Right there on my live chart. I took the trade. Then I looked at my current chart same session, same timeframe, same exact area on the price action. The arrow was gone. Not moved. Gone. I scrolled back on the live chart, no longer in the recording. The price area where the arrow had been? Clean. No arrow. Like it had never existed. I sat there for probably a full minute without moving. Then I went back to the recording. Played it again. Arrow was there at 9:47. Unmistakable. Big blue arrow telling me to buy. Back to my current chart. Nothing. I did this maybe five or six times. Recordings: arrow. Live chart: no arrow. That's when my stomach dropped in a way that had nothing to do with the trade. I'd heard the word "repainting" before. I'd seen it in comments on YouTube. I assumed it meant something minor. Like the colour changed or the position shifted slightly. I didn't understand that it meant the indicator was rewriting its own history. That when conditions changed, it would delete signals that had previously appeared... signals I had already traded off and replace them with new signals that fit the current price action perfectly. So in hindsight, my chart always looked like a genius called every move correctly. In real time, I was trading signals that the indicator itself would later decide never happened. I've been trading with a tool that was lying to me. Not because the seller was necessarily trying to play me...maybe he didn't even know. But the math underneath it was built in a way that let it revise the past. And every time I lost, I sat in front of that chart thinking I was the problem. I wasn't the problem. My tool was showing me a clean history that didn't exist when it mattered. I'm not going to pretend the next few weeks were easy. They weren't. Because once you understand this, you start asking the question about every indicator you've ever used. And the answer isn't always comfortable. But I also started asking a different question. Not "which indicator has the best signals?" I'd been asking that for three years. That question had cost me R6,000+. The new question was: does this indicator show me the same signal live that it shows me on the history? Does it commit to its signal in real time or does it only look good after the fact? That's a testable question. You don't have to trust anyone's word on it. You can open a chart, watch it live, and scroll back an hour later. If the arrows moved, you have your answer. When I found the FX Punters System, I did exactly that. I watched it live for four days before I did anything else. Opened the chart at different sessions. Wrote down where the arrows appeared. Came back later and checked. They were still there. Same place. Every time. That sounds like a small thing. It isn't. To me after what I'd been through that was everything. I'm not here to tell you this indicator will make you profitable. I don't know your risk management. I don't know your lot sizes or your account size or how you handle a losing streak psychologically. Those things are yours to figure out. What I'm telling you is this: if your entries look good on the backtest but fall apart live, there's a real possibility that your indicator is repainting and that nobody told you to check. I didn't know to check for almost three years. The FX Punters MT5 System was built specifically to not do that. The signals appear in real time and stay. It was designed for the instruments most of us actually trade Nas, Boom and Crash, Gold, Volatility indices. Not adapted from some EUR/USD strategy that someone repurposed for synthetics. Built for it. There's also a full explanation of how it works on the product page. Not a vague "proprietary algorithm" explanation. Actual logic. If you understand trend structure, it will make sense to you. The price is R1,899. Once off. Not a monthly subscription. Once off. and THAT'S IT. I still think about that plate of food I walked past four times. My wife didn't say anything that night. She's learned not to not because she doesn't care, but because she knows there's a version of this that works, and I haven't given up finding it. She was right to keep quiet. I just needed to finally ask the right question. If you've been blaming yourself for three years and your chart keeps lying to you in hindsight the link is below. Just check if it repaints first. Watch it live. Come back an hour later. That's all I'm asking you to do.
Where the ad sends people
fxpunters.co.za
Read if you have an MT5 indicator
FX PUNTERS WAS MADE FOR TRADERS- BY TRADERS This system is more than technical indicators. It embodies the spirit of resilience, continuous learning, and a passion for helping others succeed. Are you ready to look in the mirror and ditch the endless strategy hunt and trade with confidence? The FX Pu...
Shop now: fxpunters.co.za(opens in a new tab)