
Key Takeaways
- 1Target a 1.5% to 2.0% CTR and $75+ AOV to survive rising ad costs.
- 2Deploy AI tools to personalize landing pages and predict customer behavior.
- 3Factor in vertical-specific metrics like a 20-30% return rate for apparel.
- 4Build email lists in early fall to combat 2-3x CPM increases during Q4.
- 5Optimize mobile UX with digital wallets and sticky add-to-cart buttons.
In 2026, aiming for average e-commerce metrics means aiming for bankruptcy. Discover the new CTR, AOV, and conversion benchmarks you need to survive, plus actionable AI and CRO strategies to push your brand into the profitable top 1%.
If you are aiming for "average," you are aiming for bankruptcy.
In 2020, you could build a decent business by being average. You could have an average product, an average website, and run average ads, and you would make a little bit of money.
In 2026, the middle has hollowed out.
The Ecom Benchmarks have shifted dramatically. The costs of advertising have risen, customer expectations have skyrocketed, and the competition is fierce.
To survive today, you need to be an outlier.
The New 2026 Ecom Benchmarks
Let's look at the reality of the data. Here are the key e-commerce benchmarks successful brands are hitting in 2026:
CTR (Click-Through Rate): 1.5% - 2.0% (used to be 1.0%)
CPC (Cost Per Click): Rising across all platforms due to saturation.
AOV (Average Order Value): Must be $75+ to absorb ad costs.
LTV (Lifetime Value): Must be 3x your CAC within 60 days.
If your numbers are below these, you aren't just "underperforming." You are dying a slow death.
Vertical-Specific Ecom Benchmarks
Of course, "e-commerce" is broad. Here is a breakdown by industry:
Fashion & Apparel Metrics
Conversion Rate: 2.5%
Return Rate: 20-30% (You must factor this into your margin!)
Key Driver: Visuals. You need 5+ images per product.
Health & Beauty Metrics
Conversion Rate: 3.5%
Retention Rate: 40% (This is a subscription game).
Key Driver: Social Proof. Reviews and UGC are everything.
Consumer Electronics Metrics
Conversion Rate: 1.5%
AOV: $150+
Key Driver: Specs and Trust. Detailed product pages are required.
Why the Ecom Bar Raised in 2026
Two primary factors drove this massive change in performance standards: Privacy and AI.
Privacy changes (like iOS updates) made tracking harder. This meant "lazy" marketing stopped working.
Simultaneously, AI tools raised the floor for creative quality. Suddenly, AI leveled the playing field, allowing even small brands to produce high-quality ads at scale.
This means the "average" ad is now much better than it was 5 years ago. To stand out, you have to be exceptional.
The Conversion Rate Optimization (CRO) Checklist
You can't just fix your ads; you have to fix your site. If you are sending expensive traffic to a leaky bucket, you will lose your entire ad budget.
Speed: Does your site load in under 2 seconds? (Use AI to compress images).
Mobile: Is the "Add to Cart" button sticky on mobile?
Trust: Do you have "As Seen In" logos and verified reviews above the fold?
Offer: Is your shipping policy clear? "Free Shipping over $50" increases AOV.
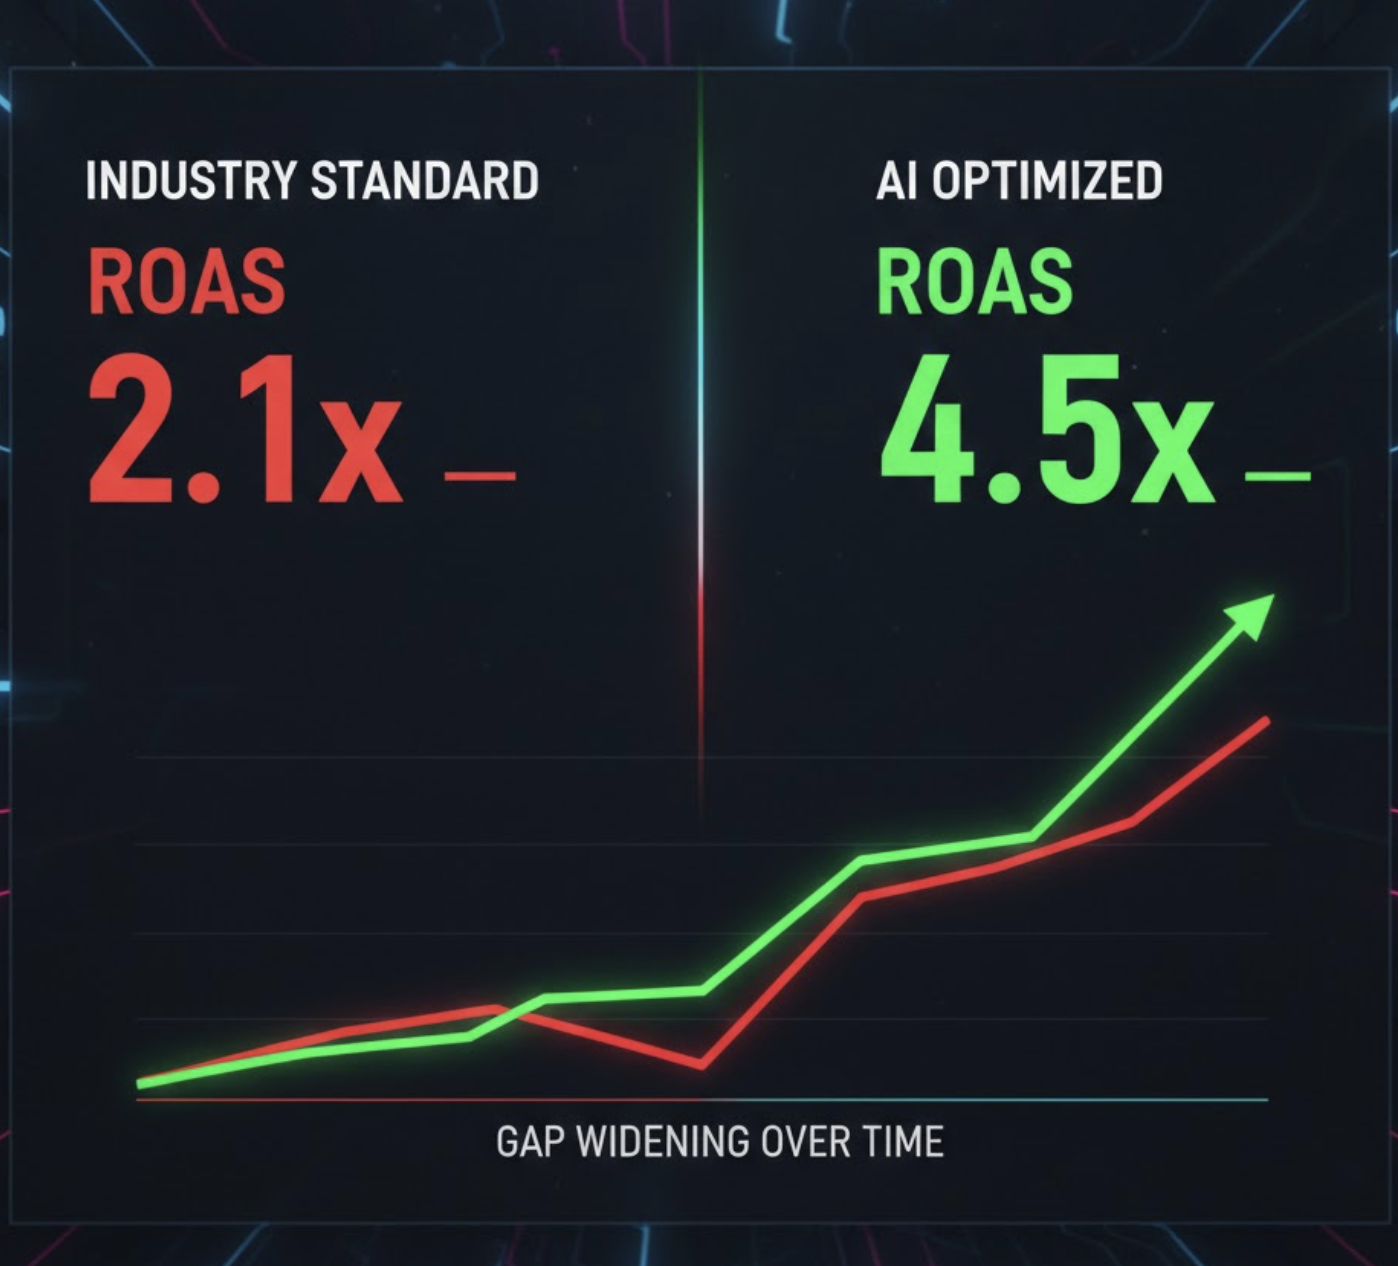
Case Study: Raising ROAS from 1.5 to 4.0
We worked with a jewelry brand stuck at 1.5 ROAS. They were breaking even, constantly battling scaling anxiety as they tried to grow their daily spend.
The Problem: Their ads were generic ("Buy our rings") and their landing page was cluttered with unnecessary distractions.
The Fix:
We used TryCrush.ai to generate and launch 50 new ads focused on gifting ("The perfect gift for her").
We used AI to rewrite their product descriptions to be more emotional and conversion-focused.
We implemented a seamless post-purchase upsell funnel.
The Result: ROAS jumped to 4.0 within 30 days. The AOV increased from $60 to $85 directly due to the new upsells.
How to Beat the Ecom Benchmarks Using AI
You cannot beat the benchmark by working harder. You can only beat it by working smarter.
The brands that are crushing the Ecom Benchmarks are the ones using AI to optimize every single step of their marketing funnel.
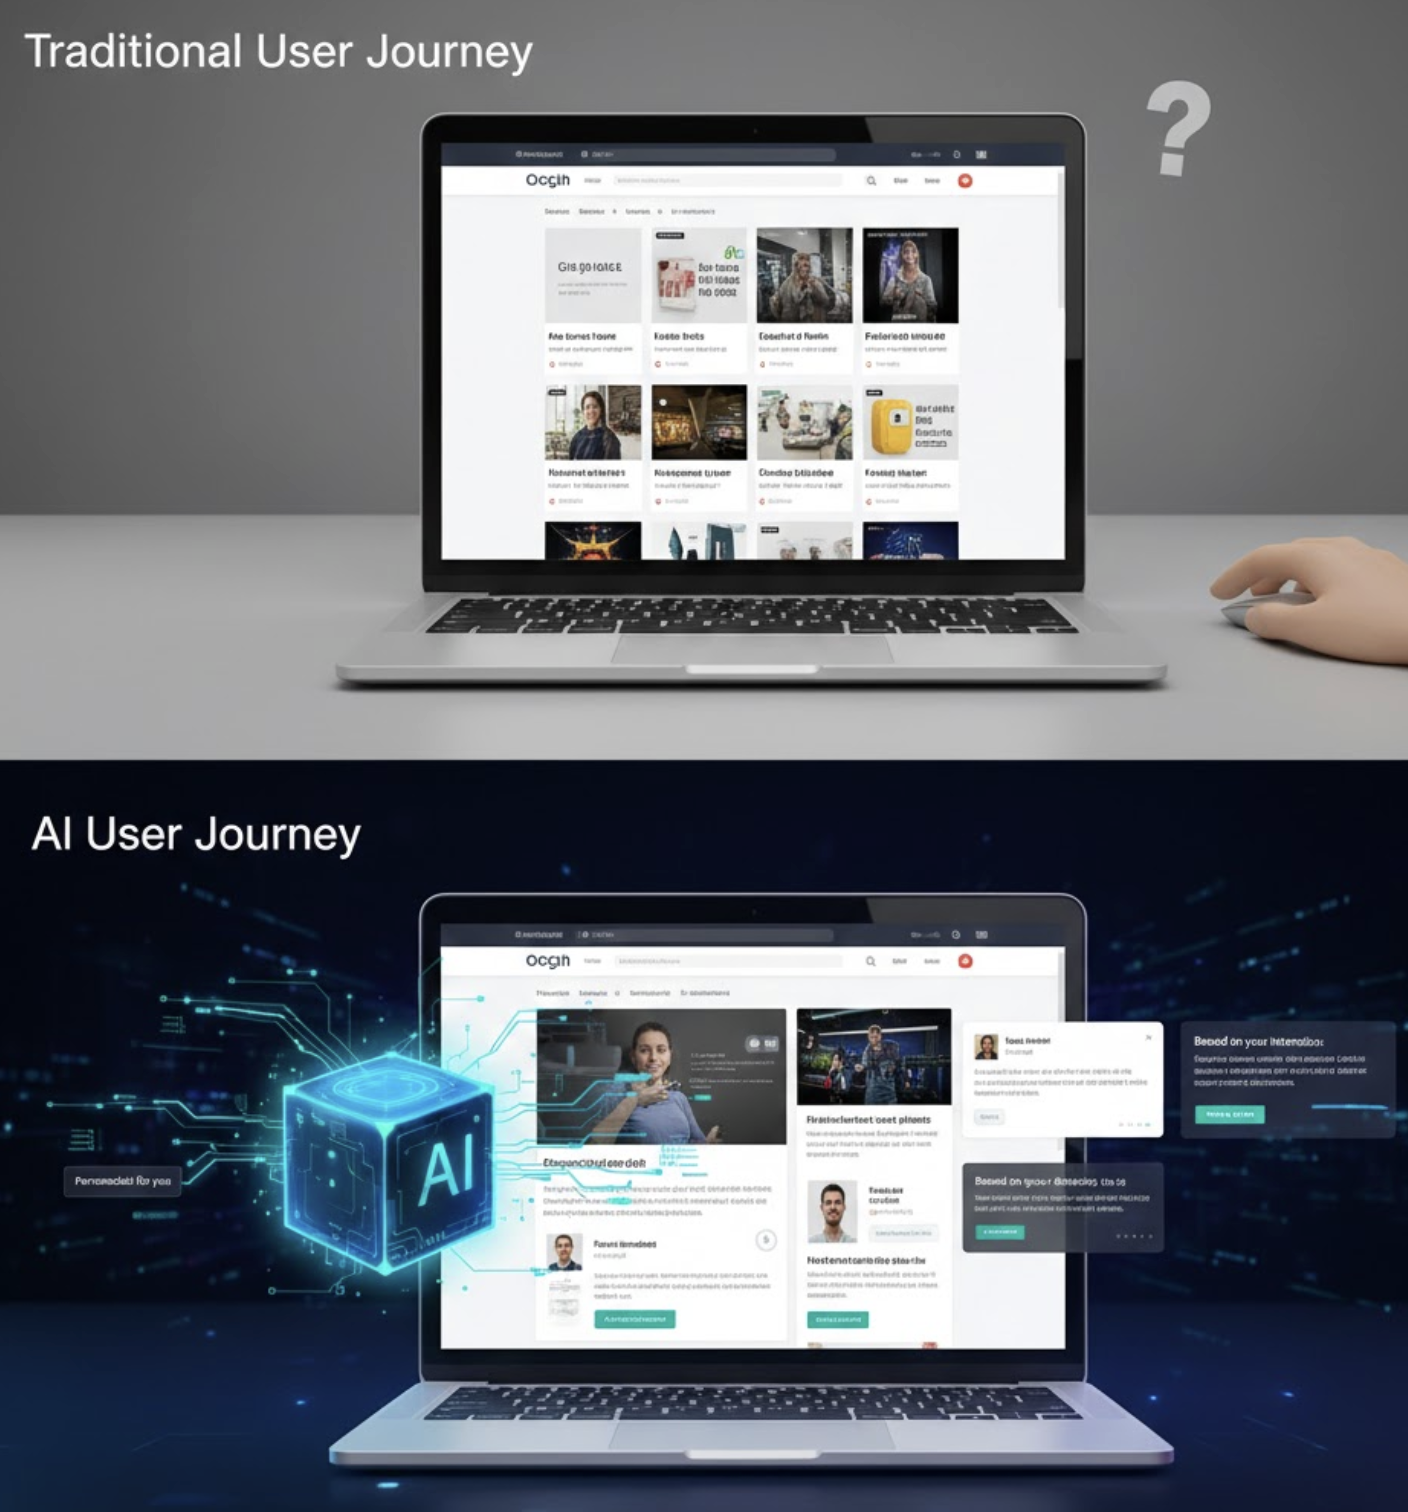
Top-tier brands use AI to:
Personalize the landing page experience for every unique visitor.
Retarget users with dynamic creative ads based on their exact browsing behavior.
Predict which products a user will most likely buy next.
This level of optimization pushes their conversion rate up, which naturally lowers their CPA, which optimizes their ultimate cost per acquisition and raises their overall ROAS.
Benchmark Adjustment for Seasonality (Q4 Strategy)
Averages lie because they smooth out the peaks and valleys of the year. In Q4 (Black Friday/Cyber Monday), the benchmarks shift wildly.
CPM: Expect a 2-3x increase. Advertising becomes extremely expensive as massive brands enter the auction.
Conversion Rate: Should double or triple. If your CR stays flat during BFCM, your core offer is too weak.
AOV: Should increase significantly as people buy multiple gifts.
Strategy: Don't try to acquire new customers in late November. It's too expensive. Build your email list in September and October when CPMs are lower, then strictly monetize that list in November.
Why Mobile Traffic Requires Different Optimization
In 2026, 90% of your traffic is mobile. If you are designing for desktop first, your strategy is inherently flawed.
Mobile benchmarks are notoriously harder to hit because the user is constantly distracted. They are on the bus, in the bathroom, or watching TV while browsing.
To win on mobile devices, you need to aggressively reduce friction. Use digital wallets like Apple Pay and Google Pay. Remove every unnecessary form field during checkout. Make your call-to-action buttons huge and easily clickable.
Don't Settle for Industry Averages
Looking at industry averages is a dangerous trap. It makes you feel safe when you shouldn't.
"Oh, my CTR is 1.0%, that's average. I'm doing okay."
No, you're not. You are vulnerable to any shift in the market.
Use robust AI tools like TryCrush.ai to push your metrics to the absolute limit. Aim for the top 1%. That is where the real, sustainable profit is generated.
In the highly competitive world of e-commerce, second place is the first loser.
Frequently Asked Questions
Common questions about this topic
1What are the target e-commerce benchmarks for 2026?
2What is a good conversion rate for fashion e-commerce?
3How do e-commerce benchmarks change during Q4?
Written by

Rokas Steponavičius
Founder, CEORokas is the Founder and CEO of TryCrush.ai, an ex-IBM professional turned entrepreneur focused on building AI-driven growth platforms. With a strong background in ecommerce, performance marketing, media buying, and artificial intelligence, Rokas specializes in creating scalable, data-led systems that drive measurable revenue. His mission is to help modern businesses leverage AI to optimize acquisition, conversions, and long-term profitability.
Stop Guessing.
Start Crushing.
AI Ad Manager trained by world-class media buyers to generate your creatives and optimize your ads 24/7.
Learn more
Continue Reading

What is Media Buying in 2026? The AI Revolution
The digital revolution changed advertising forever, but AI is completely rewriting the rules. Learn what media buying is today, why manual bidding is dead, and how modern marketers use creative strategy and AI algorithms to scale profitably.
What is Conversion Rate? How to Optimize It With AI
Understanding your conversion rate is the key to multiplying your business revenue without increasing ad spend. Move past slow, manual A/B testing and discover how AI-driven hyper-personalization is revolutionizing conversion rate optimization.
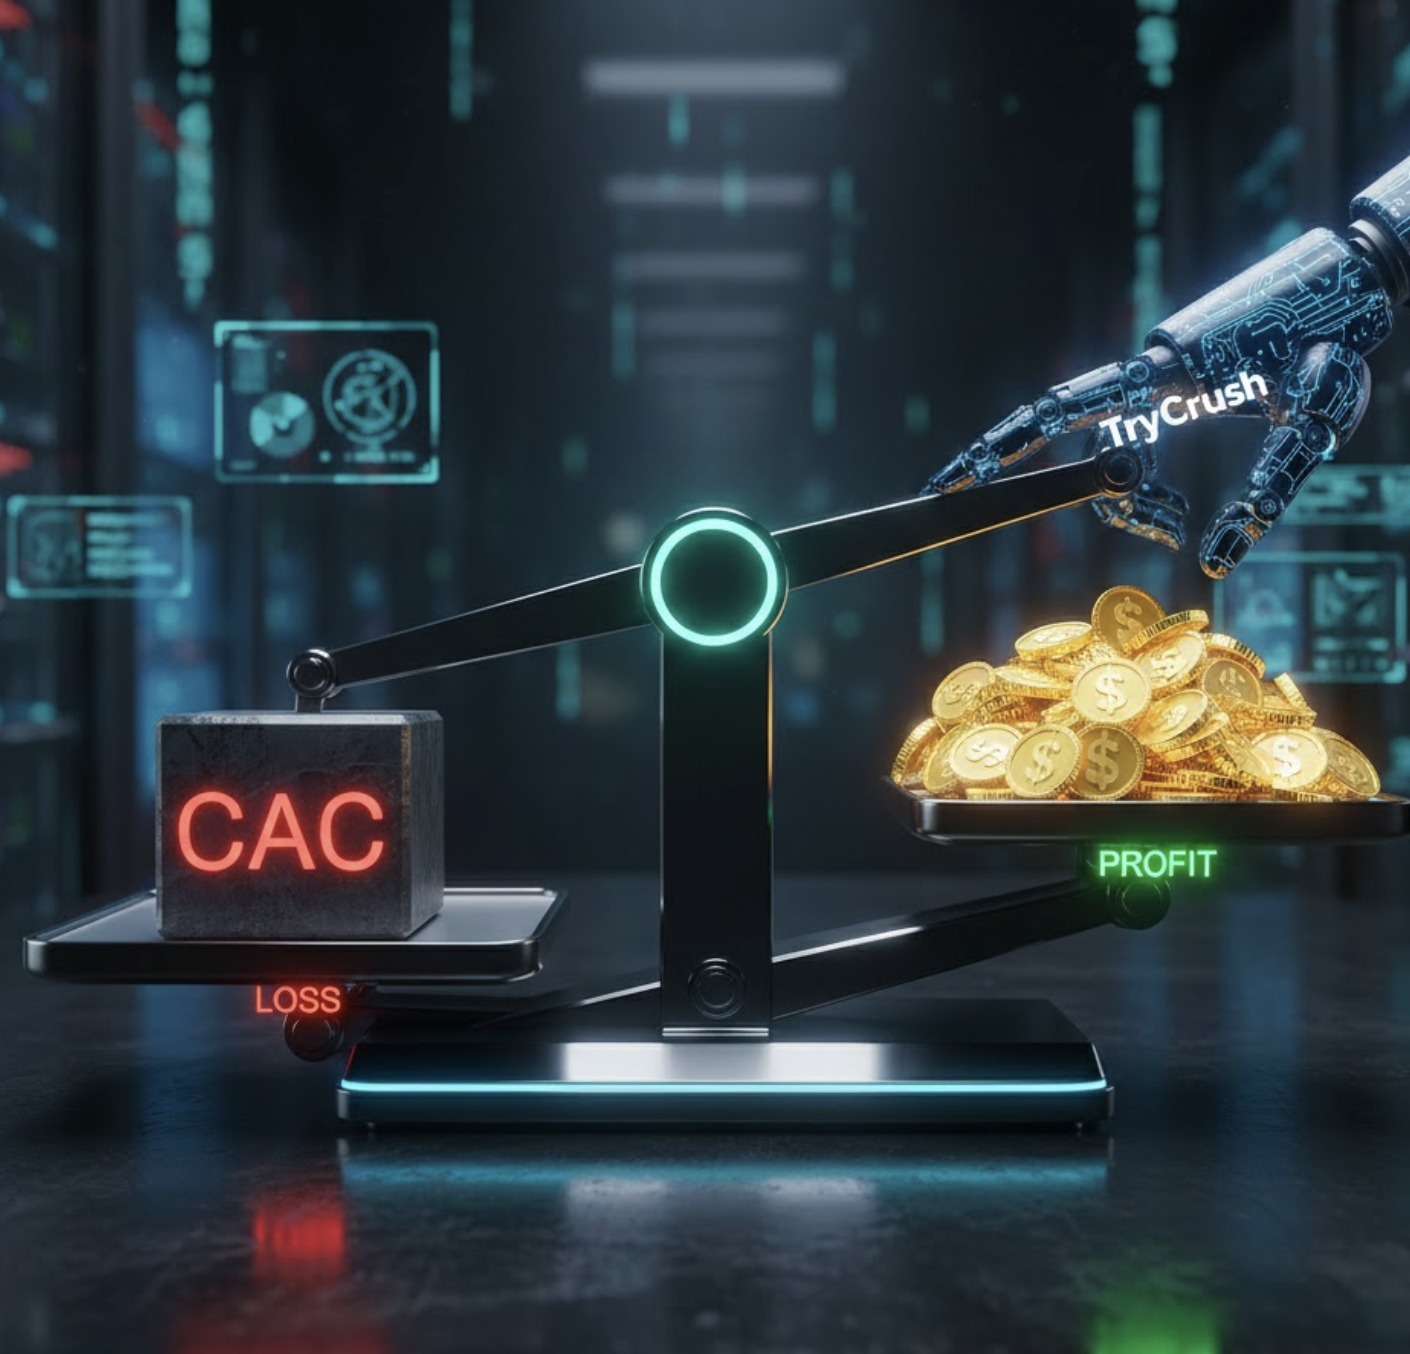
What is CAC? How AI Can Cut Your Acquisition Costs in Half
Customer Acquisition Cost (CAC) is the ultimate metric for business survival. Learn the true CAC meaning, the golden LTV:CAC ratio, and how AI-driven creative testing can systematically cut your acquisition costs in half.