The Facebook Ads Manager dashboard is designed to confuse you.
By default, it shows you columns like "Reach," "Impressions," "Frequency," "Clicks," and "ThruPlays."
It feels like you are flying a spaceship. But here is the secret: 90% of those numbers are noise.
If you try to optimize for everything, you optimize for nothing. You can have a great CTR (Click Through Rate) and go bankrupt.
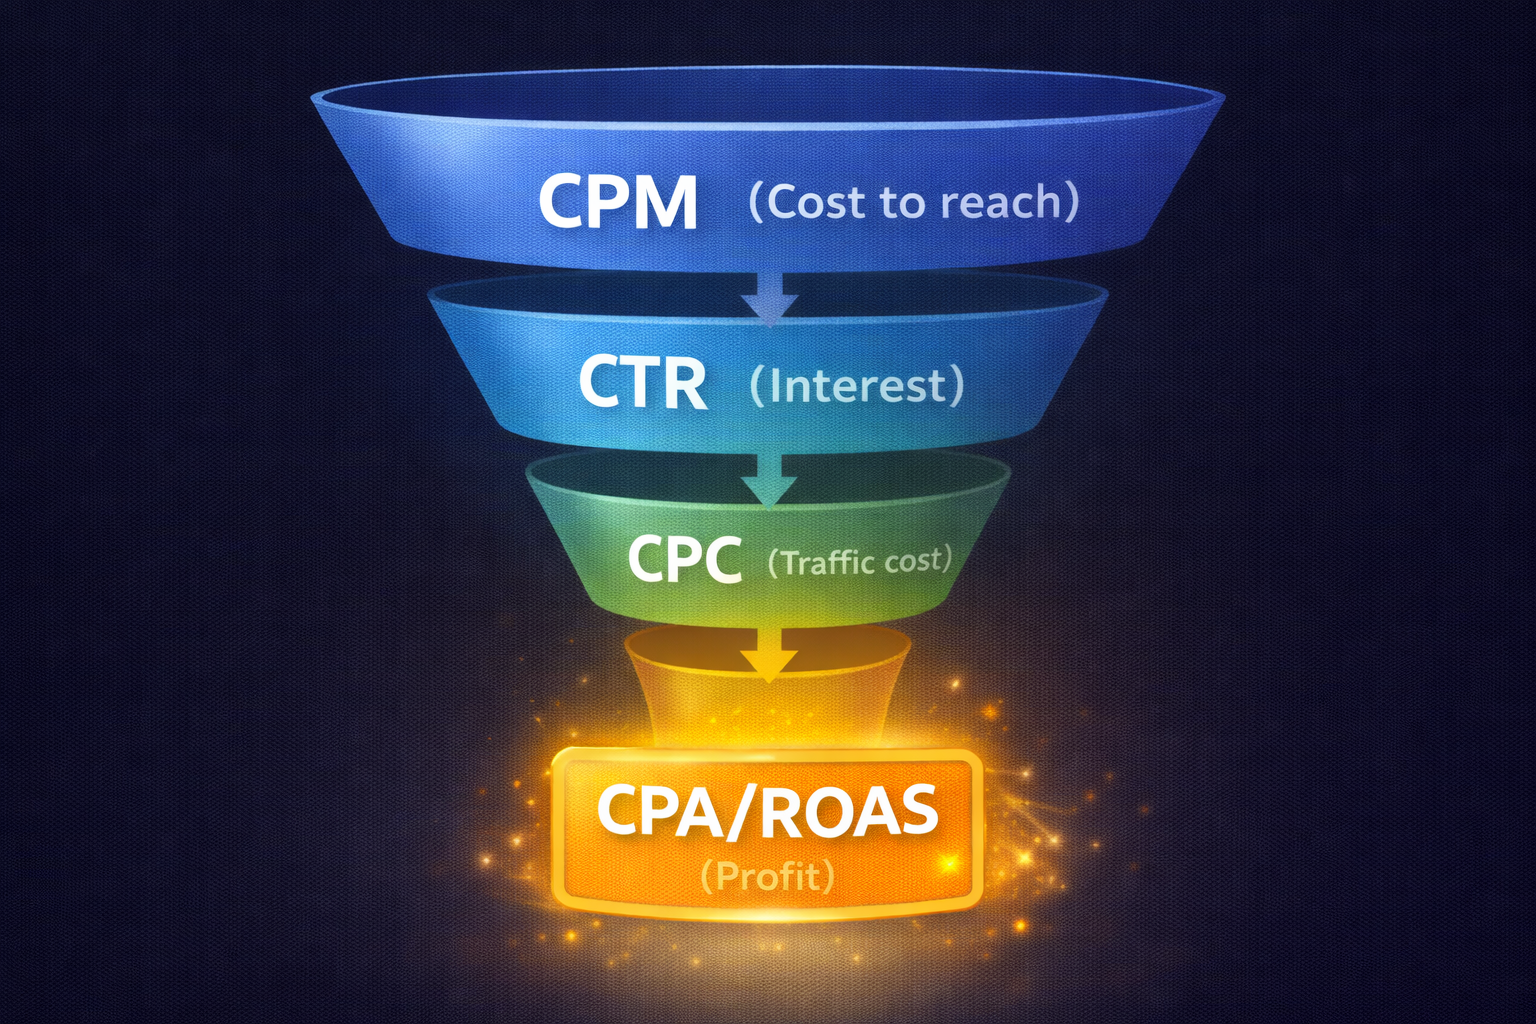
In this guide, we will cut through the clutter. We will identify the essential kpi facebook ads metrics that actually tell you if you are making money, and we will explain the nuance of cost per click facebook data.
The "North Star" Metric: ROAS vs. MER
There is only one reason to run ads: Profit.
Therefore, your primary KPI must be financial.
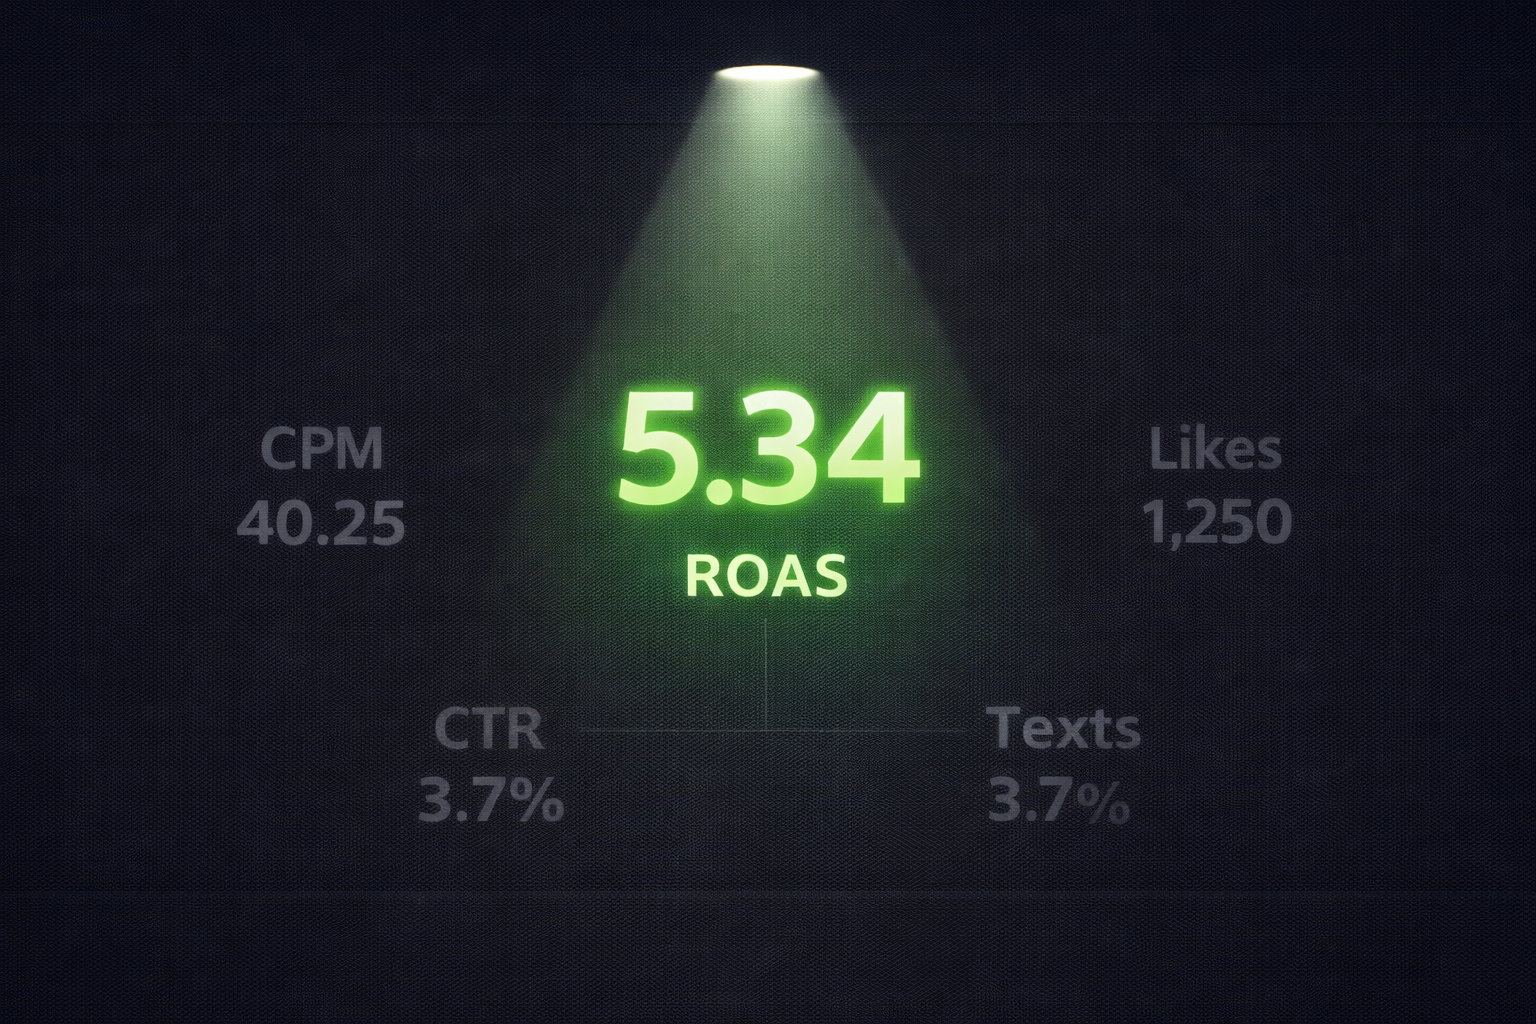
1. ROAS (Return on Ad Spend)
Formula: Revenue / Ad Spend.
If you spend $100 and make $300, your ROAS is 3.0.
Why it matters: It tells you the direct efficiency of your ads. Every business should have a "Break-Even ROAS." If your margin is 50%, your Break-Even ROAS is 2.0. Anything above 2.0 is profit.
2. MER (Marketing Efficiency Ratio)
Formula: Total Store Revenue / Total Ad Spend.
Why it matters: Since iOS14, tracking is imperfect. Facebook might miss some sales. This phenomenon, often called Data Blindness, means relying solely on pixel data can be misleading. MER tells you the "holistic" truth. If your bank account is growing, your MER is healthy, even if Ads Manager reports a lower ROAS.
If ROAS is down, how do you fix it? You cannot just yell at the screen. You need to perform a diagnosis. Think of ROAS as your body temperature. If it's high (fever), you are sick. But the thermometer doesn't tell you why. You need to look at your secondary metrics to find the infection.
3. CPA (Cost Per Acquisition)
This is simply: Total Spend / Total Sales.
How much does it cost to get one customer? This is often a more stable metric than ROAS because it doesn't fluctuate with order size. If you sell products with different price points ($20 vs $100), your ROAS will swing wildly depending on what people buy. Your CPA, however, should remain relatively consistent. This stability is why we recommend you optimize for Cost Per Acquisition alongside ROAS.
Target Setting: Your Target CPA should be based on your Unit Economics. If your Average Order Value (AOV) is $60 and your COGS (Cost of Goods Sold) + Shipping is $20, your Break-Even CPA is $40. Anything below $40 is profit.
4. Hook Rate (Thumb Stop Rate)
Formula: 3-Second Video Plays / Impressions.
Benchmark: Aim for >30%. (Top 1% ads hit 40-50%).
What it tells you: Is your ad boring? The Hook Rate measures the first impression. If you show your ad to 1,000 people and only 100 watch the first 3 seconds (10%), your creative is failing immediately. It means your visual or your opening line didn't stop the scroll.
The Fix: Change the first 3 seconds. Use a weirder visual. Ask a provocative question. Show the product immediately. Do not change the whole video, just swap the intro. This targeted approach helps you avoid the myth of creative fatigue by iterating on what works.
5. Hold Rate (Retention Rate)
Formula: ThruPlays (15s) / 3-Second Video Plays.
What it tells you: Is your content interesting? Hook Rate gets them in the door; Hold Rate keeps them in the room.
If your Hook Rate is high (40%) but your Hold Rate is low (5%), you are guilty of "clickbait." You grabbed their attention, but you lost it instantly because the rest of the video was boring, irrelevant, or slow.
The Fix: Increase the pacing. Cut out the "umms" and pauses. Add b-roll. Change the angle every 2-3 seconds. Ensure the content actually delivers on the promise made in the hook.
6. Link Click-Through Rate (CTR)
Benchmark: Aim for >1.0% (Broad audience).
What it tells you: Is your offer compelling? They watched the video (Hook + Hold), but did they click?
If people watch your whole video but don't click, your Call to Action (CTA) is weak, or the product simply doesn't solve a painful enough problem.
Understanding Cost Per Click (CPC)
Cost per click facebook is the most misunderstood metric.
Scenario:
Ad A has "cheap clicks." Ad B has expensive clicks. But Ad B is 2.5x more profitable.
High-quality audiences (people with money) cost more to click. But they buy more.
When to worry about CPC: If your CPC suddenly spikes from $1.00 to $5.00 overnight, something is wrong. Usually, it means your creative has fatigued or your audience is too small.
Vanity Metrics to Ignore (The "Ego" Numbers)
In the boardroom, it's easy to get distracted by big numbers that mean nothing. Please, stop reporting these to your boss/client. They do not pay the rent.
1. Likes, Shares, and Comments
Social proof is good, but it is not currency. We have seen viral posts with 10,000 likes generate zero sales because the content was "funny" but not "persuasive." Conversely, we have seen "ugly" ads with 5 likes generate $50,000 in revenue because they hit a specific nerve for a specific buyer.
2. Reach and Impressions
Reaching 1 million people is useless if they are the wrong people. Agencies love to report "We generated 1 Million Impressions!" because it sounds big. But if those impressions are cheap, low-quality traffic from the Audience Network, they are worthless.
3. Cost Per Click (CPC) - In Isolation
As we discussed, a low CPC does not equal high profit. Optimizing for the lowest CPC will often lead you to low-quality audiences (click farms, bots, accidental clicks). Ignore CPC unless you are analyzing why your CPM spiked.
4. Cost Per Page Like
This is a relic from 2015. Organic reach for Business Pages is effectively zero (less than 1%). Paying money to get someone to "Like" your page is lighting money on fire. You will have to pay again to show them an ad anyway.
How to Create a Custom Reporting Column
Stop using the default view. Just as you need to structure your Facebook ad account for clarity, you must organize your reporting for speed. Create a "Profit View."
Step 1: Click "Columns" > "Customize Columns."
Step 2: Delete everything.
Step 3: Add these in order:
Amount Spent
Purchase ROAS
Cost Per Purchase (CPA)
Purchases
CPM
CTR (Link Click-Through Rate)
CPC (Cost Per Link Click)
Hook Rate (Custom Metric)
Save this as "Daily Check." Now you can see the truth in 5 seconds.
Conclusion
Data is only useful if it leads to a decision.
Trace the problem back to the source. Don't panic over noise.
Overwhelmed by data? Crush calculates your real-time profitability and highlights only the metrics that need attention.